
Key takeaways
- The live chat software market was worth $1.21 billion in 2025 and is forecast to reach $1.78 billion by 2030. (Mordor Intelligence, 2025)[3]
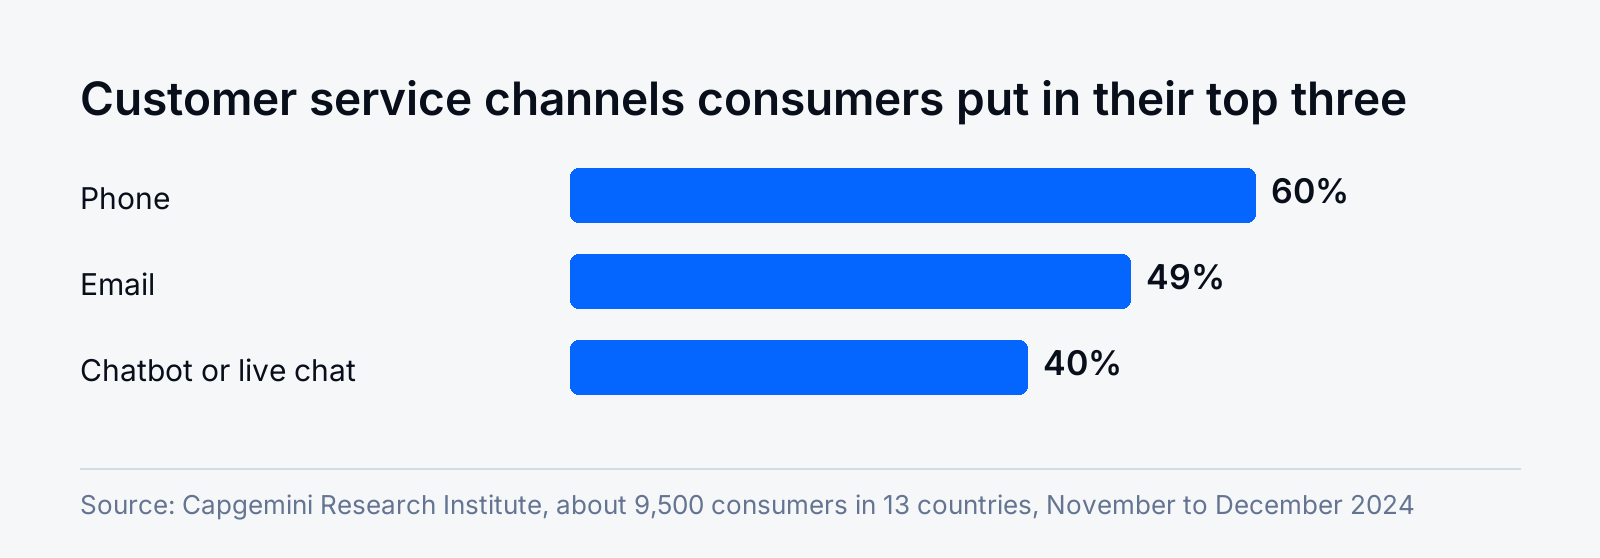
- 40% of consumers put a chatbot or live chat in their top three preferred customer service channels, up from 32%, while phone stays on top at 60%. (Capgemini Research Institute, 2024)[4]
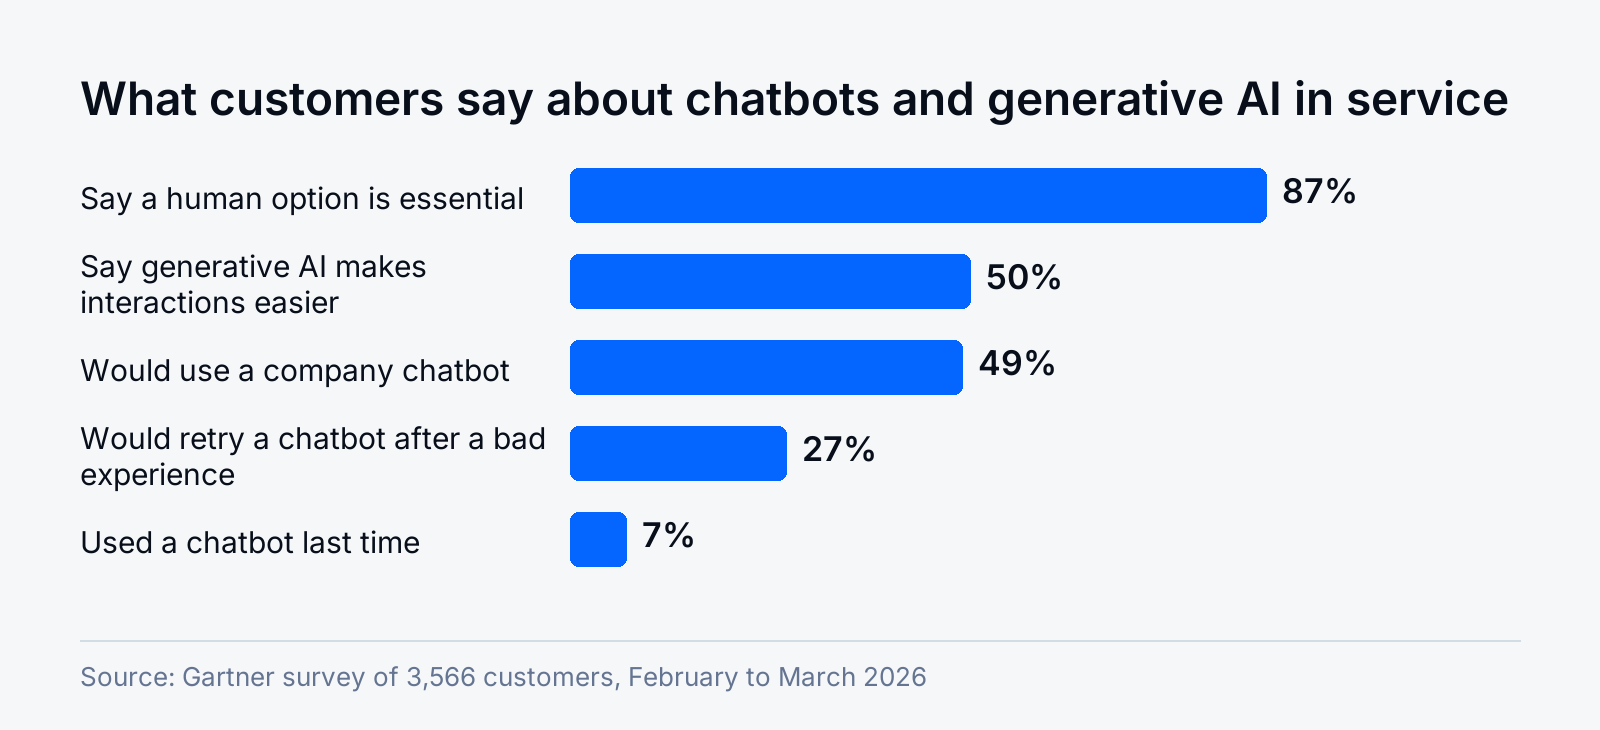
- 87% of customers say a way to reach a human agent is essential when companies use generative AI for service. (Gartner, 2026)[1]
- Only 7% of customers used a chatbot or digital assistant in their last service interaction, although 49% said they would have been willing. (Gartner, 2026)[2]
- An inbound phone call costs U.S. contact centers 23% more than a web chat. (ContactBabel, 2025)[5]
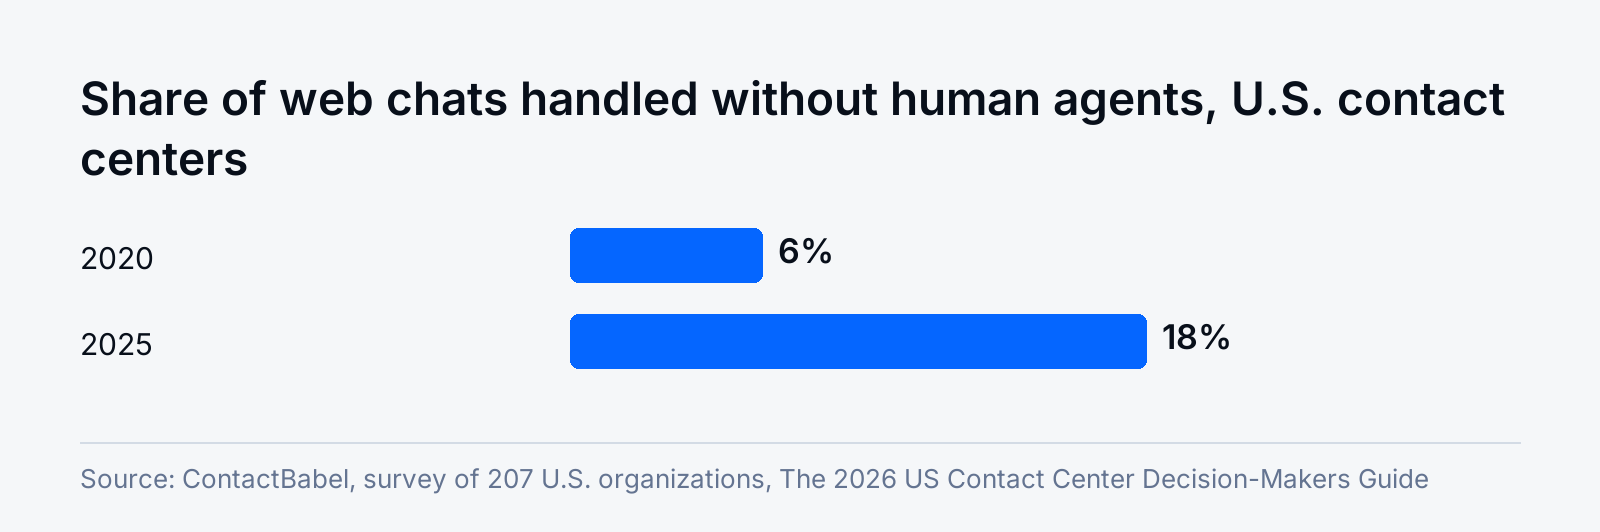
- 18% of web chats in U.S. contact centers are handled without human agents, up from 6% in 2020. (ContactBabel, 2025)[5]
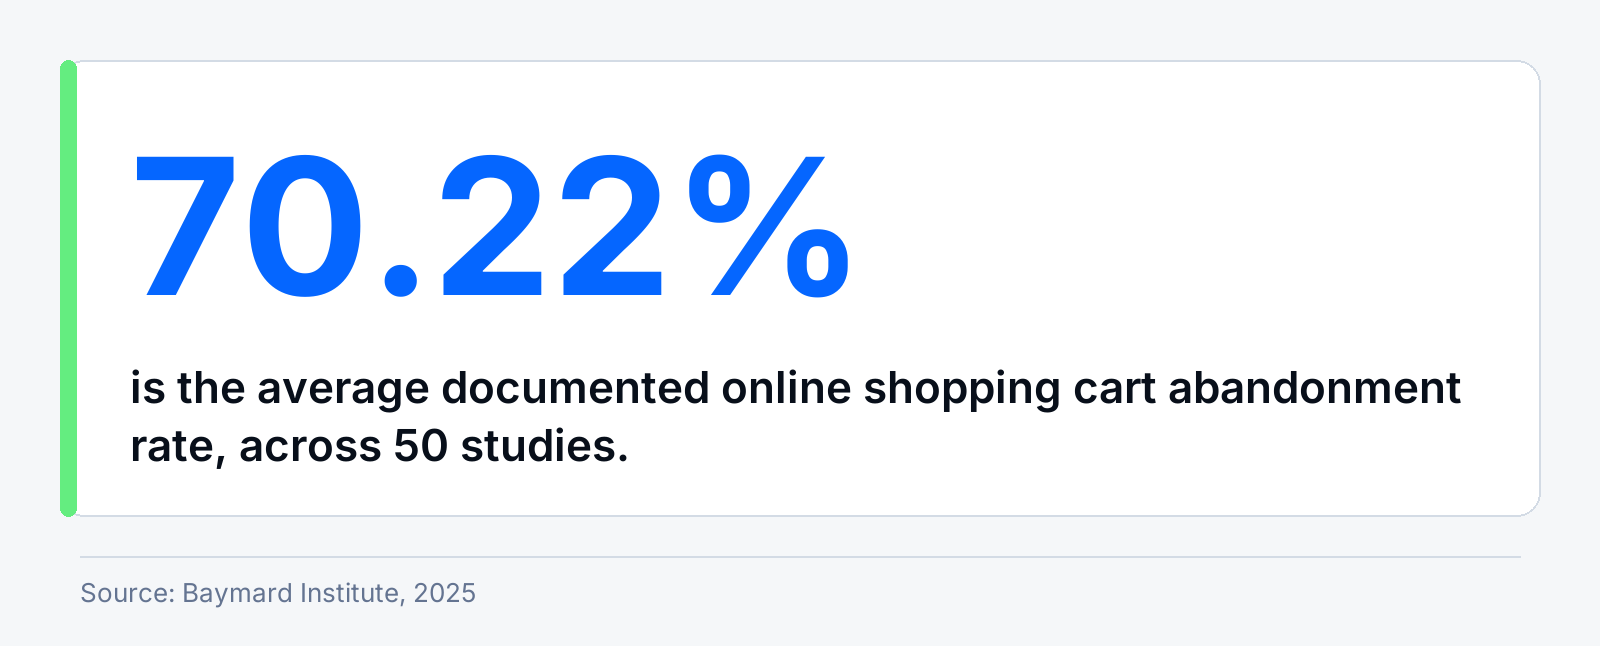
- 70.22% of online shopping carts are abandoned, the pool of shoppers a chat conversation can still reach. (Baymard Institute, 2025)[6]
- Human-plus-bot conversations reached a 57% resolution rate, against 29% for bots alone. (Contentsquare, in Tidio's AI in E-Commerce report, 2026)[7]
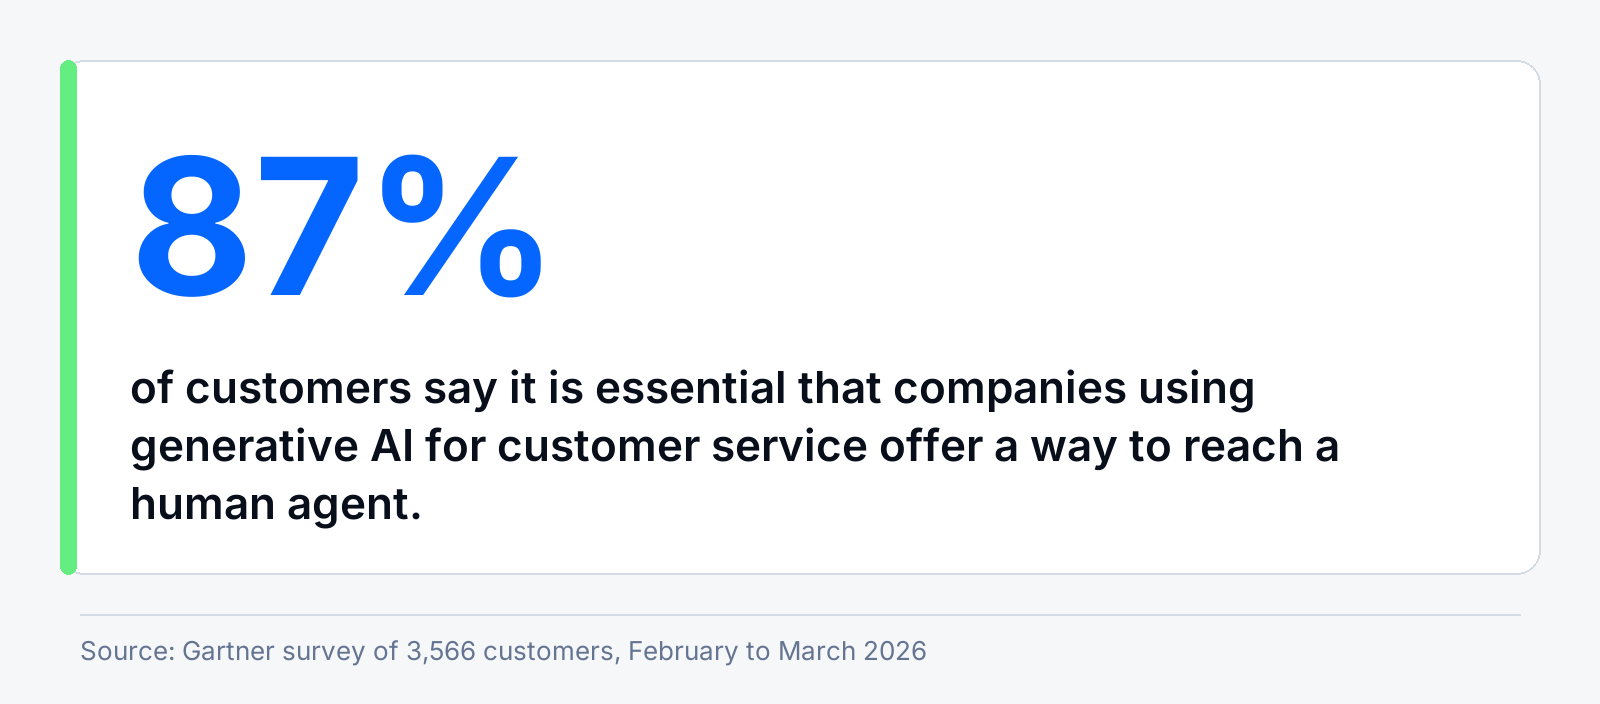
Live chat sits between the phone and the help center, and the newest research shows where it is gaining and where it is not. In a 2026 Gartner survey, 87% of customers said a route to a human agent is essential whenever a company uses generative AI for service, and only 7% had used a company chatbot in their last service interaction.[1][2]
This page collects live chat statistics from Gartner, Forrester, Capgemini, PwC, ACSI and others, plus figures from our own research reports. Each figure names who collected it, and the superscript number leads to the report behind it. We dropped the widely repeated live chat figures that trace back only to vendor blogs.
Use live chat to support your customers in real-time
Live chat market and adoption statistics
Live chat is a small software category with a large footprint, because most support teams run it alongside email and phone. Market researchers disagree on its size by a factor of almost six, because each firm defines the category differently. Gartner's surveys of service leaders show where the channel is heading.
- The global live chat software market is worth $1.21 billion in 2025 and is forecast to reach $1.78 billion by 2030, an 8.03% compound annual growth rate. (Mordor Intelligence, 2025)[3]
- Fortune Business Insights sizes the live chat software market at $6.96 billion in 2025 and projects $51.22 billion by 2034, a 24.83% compound annual growth rate. (Fortune Business Insights, 2025)[8]
- 40% of consumers in 13 countries put a chatbot or live chat in their top three preferred customer service channels, up from 32% one to two years earlier. Phone is at 60% and email at 49%. (Capgemini Research Institute, survey of about 9,500 consumers, 2024)[4]
- Technologies for digital-first service, including live chat, will overtake phone and email as the most valuable customer service technologies within two years, according to 265 customer service leaders. This is a forecast. (Gartner, 2025)[9]
- Service and support leaders say live chat and phone remain their most valuable channels today, and 199 surveyed leaders expect generative AI chatbots to top the list within two years, followed by live chat. (Gartner, 2026)[10]
- 51% of customer service journeys now begin on third-party platforms such as Google, YouTube and ChatGPT, and only 22% of customers start, stay and resolve an issue in a company's own channels. (Gartner, survey of 5,801 customers, 2025)[11]
| Source | What it measures | 2025 value | Forecast |
|---|---|---|---|
| Mordor Intelligence | Live chat software market | $1.21 billion | $1.78 billion by 2030 |
| Fortune Business Insights | Live chat software market | $6.96 billion | $51.22 billion by 2034 |
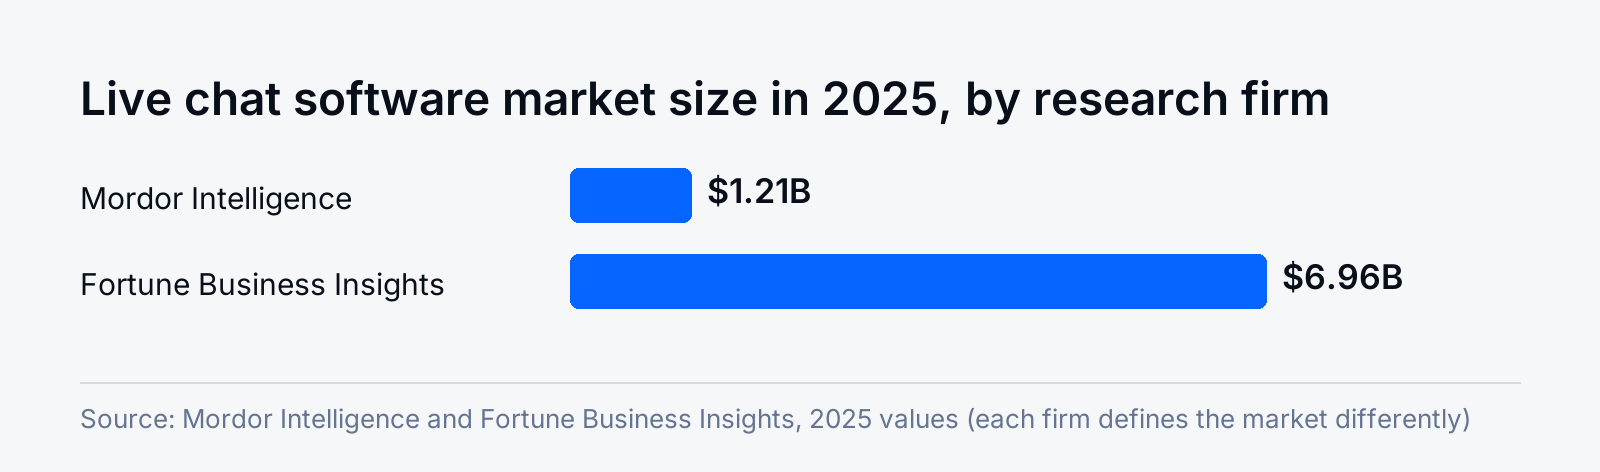
What this means: Do not quote a live chat market size without naming the firm. If you size a project on this data, use the lower estimate for planning and the higher one for upside. The better signal is the shift in leaders' priorities: live chat sits next to phone today, and they expect it to move ahead of phone and email.
Read more: What is live chat, live chat apps and how to add live chat to your website.
Live chat customer preference statistics
Preferences split by age. Younger groups are the most open to chat, older groups still pick the phone, and most customers want the option of a person.
- 61% of U.S. Baby Boomers prefer a voice call for customer service, while about two in five Gen Z prefer each of email, text, chat and voice call. (Forrester, survey of U.S. online adults, 2025)[12]
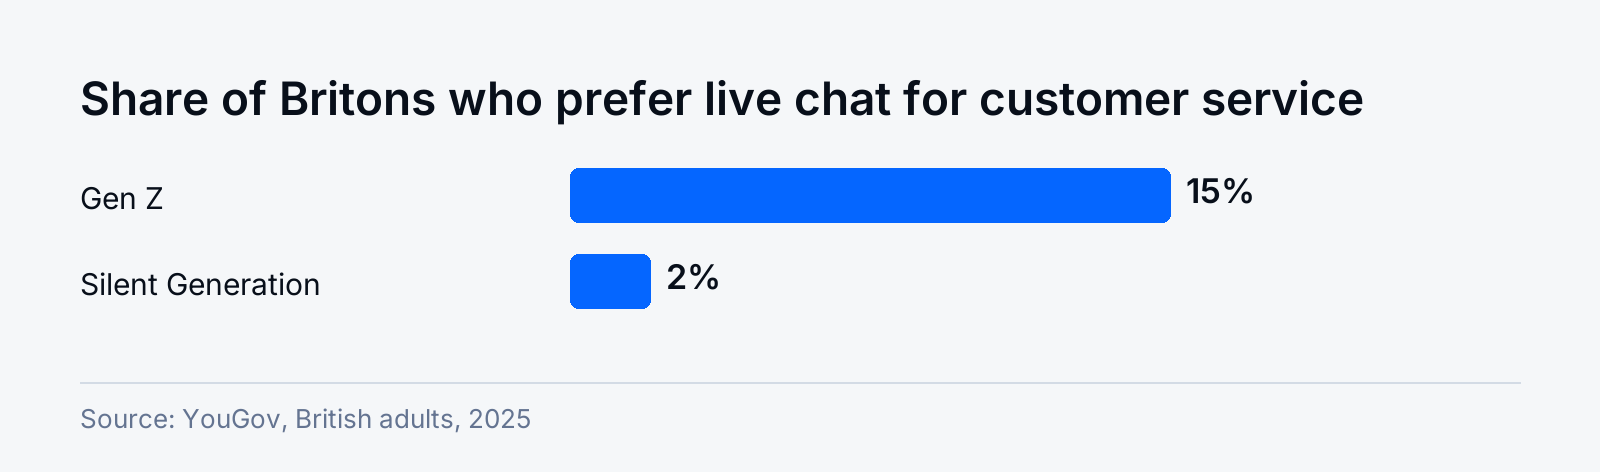
- 15% of Gen Z Britons prefer live chat, against 2% of the Silent Generation. Phone is the top channel for 16% of Gen Z and for half of the Silent Generation. (YouGov, British adults, 2025)[13]
- 71% of consumers in 13 countries feel customer service chatbots have improved in quality over the past one to two years. (Capgemini Research Institute, survey of about 9,500 consumers, 2024)[4]
- 86% of U.S. consumers say human interaction is moderately or very important in their brand experience. (PwC, survey of 5,511 consumers, 2025)[14]
- 79% of U.S. adults strongly prefer interacting with a human over an AI agent in customer service, and 89% say companies should always offer the option to speak with a human. (SurveyMonkey, survey of 2,017 U.S. adults, 2025)[15]
- 35% of customers whose last interaction was by phone are willing to adopt a generative AI digital assistant, and Gartner calls the phone the dominant service channel. (Gartner, survey of 5,801 customers, 2025)[16]
- 42% of U.S. online adults said it was important for retailers to offer live online chat on their websites, up from 27% in 2019. This is the latest figure in Forrester's series and dates from 2021. (Forrester, 2021)[17]
What this means: Offer chat as an addition to the phone, not a replacement for it, and make the human handoff visible in the widget. If you serve younger shoppers, chat is a default channel for them. If you serve older customers, keep a phone number on the contact page.
Read more: Chatbot vs. live chat, proactive live chat and customer experience.
Live chat business impact and ROI statistics
Few neutral studies publish a live chat conversion lift or an ROI figure, and the percentages that circulate most (ROI of several hundred percent, double-digit order value gains) trace back only to vendor blogs or vendor-sponsored studies. The figures below are the ones we could trace to an independent source, and the older ones are dated.
- Site visitors who use web chat are 2.8 times more likely to convert than those who do not. The figure comes from a 2018 Forrester analysis and is the oldest on this page. (Forrester, 2018)[18]
- 70.22% of online shopping carts are abandoned, the average across 50 published studies. This is not a live chat figure, but it sizes the group of shoppers a conversation can still reach. (Baymard Institute, 2025)[6]
- 40% of U.S. online shoppers who abandoned a cart named extra costs such as shipping, tax and fees as a reason, the top reason once "just browsing" is excluded. 20% blamed slow delivery and 19% did not trust the site with their card details. (Baymard Institute, 2025)[6]
- An inbound call costs U.S. contact centers an average of $7.20, which is 23% more than a web chat and 47% more than email (survey of 207 U.S. organizations). (ContactBabel, 2025)[5]
What this means: The reasons shoppers give for abandoning a cart (shipping cost, delivery time, trust in payment) are questions a person or a well-trained bot can answer on the checkout page. Track chats started on cart and checkout pages separately from the rest and compare their conversion rate. Your own before-and-after numbers are stronger evidence than any benchmark.
Read more: Live chat for sales, live chat lead generation, e-commerce live chat and benefits of live chat.
Live chat performance metrics and satisfaction statistics
Public benchmarks for chat are thinner than for phone. The most reliable satisfaction data bundles chat with other support channels, and the best operational data comes from contact center surveys.
- U.S. online retail customers rated the helpfulness of customer support (live chat, help pages and call center) 78 out of 100, up from 77. Online retailers overall scored 79. This score is not specific to chat. (ACSI, data for 2025)[19]
- U.S. online investment customers rated the helpfulness of customer support (live chat, help pages and call center) 81 out of 100, up from 77. This score is not specific to chat. (ACSI, data for 2025)[20]
- 18% of web chats in U.S. contact centers are handled without human agents, up from 6% in 2020 (survey of 207 U.S. organizations). (ContactBabel, 2025)[5]
- Average speed to answer for U.S. contact center calls is 74 seconds, one-third higher than before the pandemic. This is a phone benchmark, a useful contrast for chat response targets. (ContactBabel, 2025)[5]
- 30% to 67% of customers who abandon a chat or messaging queue do so silently, and this reduces contact center efficiency by 5% to 15%. (Castellanos, Yom-Tov and Goldberg, research paper revised in 2024)[21]
What this means: Silent abandonment is the number to watch. A customer who leaves a queue without a word never shows up in a satisfaction survey, so measure chats started against chats answered, and show a visible wait estimate. We found no current independent benchmark for chat first response time or chats per agent, so set those targets from your own history.
Read more: Live chat etiquette, customer satisfaction and customer service statistics.
AI in live chat statistics
Many live chat tools now put a bot in front of the human team. Customers use company chatbots less than they say they would, and they hold back after one bad answer. The data below is almost all customer service research on chatbots and generative AI, which is the technology now answering many live chat conversations.
How customers use chatbots
- 49% of customers say they would have been willing to use a company chatbot, but only 7% used a chatbot or digital assistant in their most recent service interaction. (Gartner, survey of 3,566 customers, 2026)[2]
- Only 27% of customers would try a chatbot again after a negative experience. (Gartner, 2026)[2]
- 87% of customers say it is essential that companies offer a way to reach a human agent when they use generative AI for customer service. (Gartner, 2026)[1]
- 50% of customers say their interactions are easier when companies use generative AI. (Gartner, 2026)[1]
- Customers are about three times more likely to use third-party generative AI tools than company-provided chatbots to resolve service issues, and use of company chatbots is statistically unchanged since 2022. (Gartner, 2026)[22]
- 54% of U.S. customers trust human agents more than AI for product or service recommendations, and 32% trust AI more. (Gartner, survey of 5,801 U.S. customers, 2025)[23]
- Over 70% of consumers prefer human agents for empathy and creative problem-solving. (Capgemini Research Institute, 2024)[24]
Business results from AI in service
- Only 24% of customer service and support leaders have shown positive financial returns across their AI use cases (survey of 1,303 senior leaders). (Gartner, 2026)[22]
- Customer service AI spending rose 38% while overall service and support budgets grew 2% (survey of 199 leaders). (Gartner, 2026)[10]
- 91% of customer service and support leaders report pressure from executives to implement AI (survey of 321 leaders worldwide). (Gartner, 2025)[25]
- Only 20% of customer service leaders have reduced agent staffing because of AI. (Gartner, survey of 321 leaders, 2025)[26]
- Klarna reported that its AI assistant handled two-thirds of its customer service chats in its first month, 2.3 million conversations. This is a company-reported figure from 2024. (Klarna, 2024)[27]
Statistics from our research reports
We publish free research reports at getayro.ai/reports. The figures below come from our AI in E-Commerce report, which cites a primary source for every number.
- Human-plus-bot conversations reached a 57% resolution rate, nearly double the 29% that bots achieved alone (analysis of 22 million customer service conversations). (Contentsquare, in Tidio's AI in E-Commerce report, 2026)[7]
- Bot-only resolution drops to 18% for refunds, 15% for technical issues and 14% for security issues. (Contentsquare, in Tidio's AI in E-Commerce report, 2026)[7]
- 82% of consumers prefer human customer support even when the outcome and the wait time are identical, from 73% of Gen Z to 91% of Boomers (global study of over 15,000 consumers). (HubSpot and SurveyMonkey, in Tidio's AI in E-Commerce report, 2026)[7]
- 69% of service professionals say their organizations use AI, and 39% say they use agentic AI. (Salesforce, in Tidio's AI in E-Commerce report, 2026)[7]
Forecasts
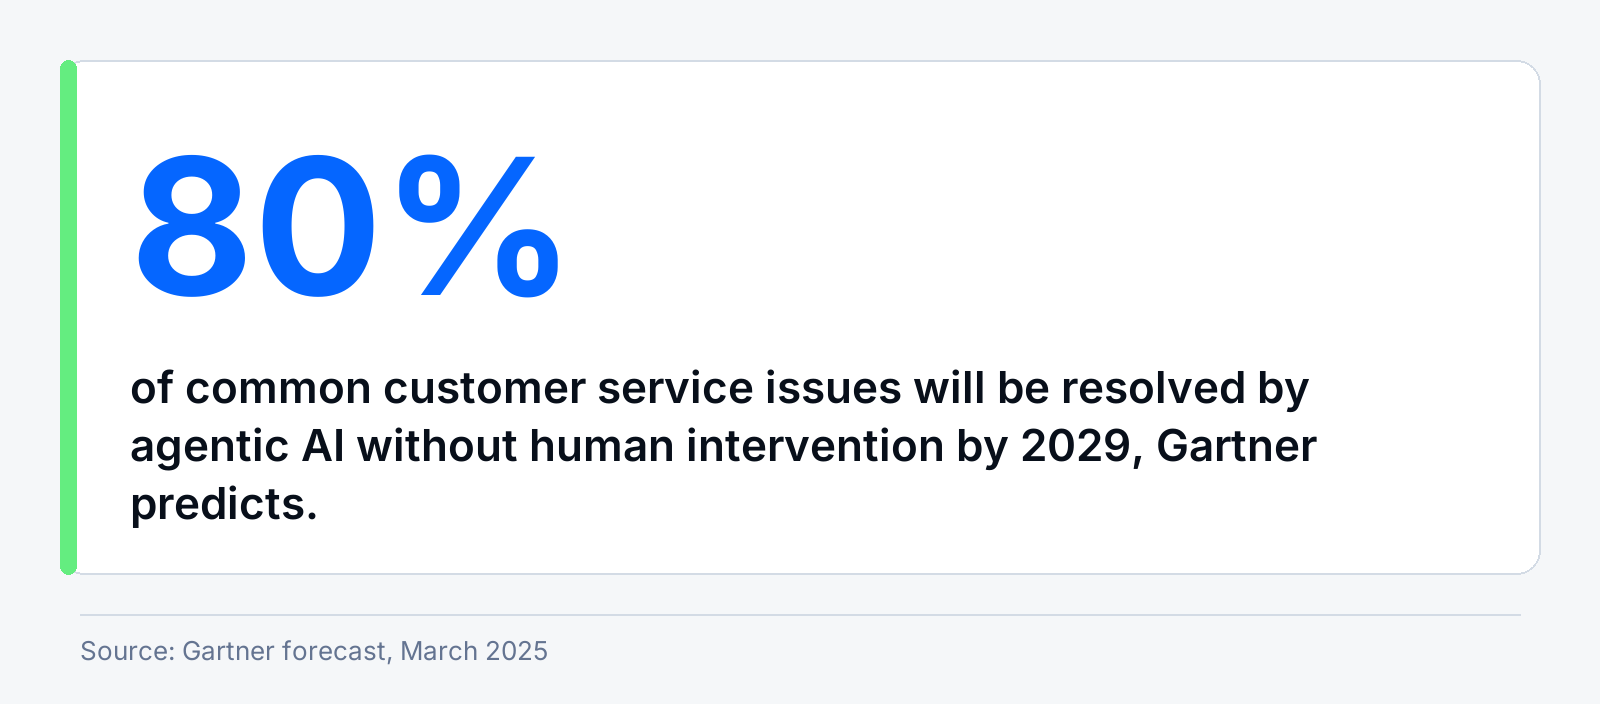
- By 2029, agentic AI will autonomously resolve 80% of common customer service issues without human intervention, and cut operational costs by 30%. This is a forecast. (Gartner, 2025)[28]
- By 2030, the cost per resolution for generative AI will exceed $3, higher than many offshore human agents in B2C. This is a forecast. (Gartner, 2026)[29]
- By 2028, AI regulation will raise assisted service volume by 30%. This is a forecast. (Gartner, 2026)[29]
- In 2026, a third of companies will harm customer experiences with frustrating AI self-service. This is a forecast. (Forrester, 2026)[30]
What this means: Put the AI in front, keep a person one click away. Human-plus-bot conversations resolve about twice as often as bots alone, and 87% of customers want the human option. Tidio's Lyro AI agent hands a conversation to your team when it cannot answer, which keeps the chat open instead of ending it.
Add live chat and an AI agent to your site with Tidio
Read more: Chatbot statistics and AI customer service.
Methodology and sources
Every statistic comes from the organization that collected it, such as a research firm's report, a press release, a ratings index or a peer-reviewed working paper, and we opened each source and found the number on the page. The one exception is the section on Tidio's reports, where each line gives the original source as the report prints it. Tidio's own unpublished numbers are left out, and so are statistics roundups and vendor blogs. Figures from before 2024 are labeled with their year. The two live chat market sizes come from different firms with different definitions and are never combined.
Live chat statistics: key takeaways
- Live chat is a small, growing software category, and market size estimates range from $1.21 billion to $6.96 billion for 2025 depending on the research firm.
- Chat is a top-three channel for 40% of consumers, with phone still ahead at 60%, and it skews younger.
- An inbound phone call costs U.S. contact centers 23% more than a web chat.
- 87% of customers want a human option whenever AI is involved, and only 7% used a company chatbot last time.
- Silent abandonment is the hidden loss, so measure chats started against chats answered.
FAQ
Estimates depend on the firm. Mordor Intelligence puts the live chat software market at $1.21 billion in 2025 and forecasts $1.78 billion by 2030.[3] Fortune Business Insights counts $6.96 billion for 2025.[8]
40% of consumers in 13 countries put a chatbot or live chat in their top three preferred service channels, against 60% for phone and 49% for email.[4] Preference varies by age: 15% of Gen Z Britons prefer live chat, against 2% of the Silent Generation.[13]
Yes. An inbound call costs U.S. contact centers an average of $7.20, which is 23% more than a web chat and 47% more than email.[5]
Yes. 87% of customers say it is essential that companies using generative AI for customer service offer a way to reach a human agent.[1]
18% of web chats in U.S. contact centers are handled without human agents, up from 6% in 2020.[5]
Start live chat with Tidio for free