
The significance of customer service in this fast-paced, digital era cannot be emphasized enough. And the competition is high in every industry, so providing a solid experience for clients is more important than ever.
Luckily, there are tons of relevant customer service statistics that will help you understand the consumers’ needs better.
So, we’ve looked at dozens of websites, reports, and surveys to compile a comprehensive list of stats you can use to improve customer experience.
Plus, to save you time, we’ve grouped them into easy-to-navigate categories, so you can quickly find what you need.
Without further ado—

Customers’ expectations
When clients become aware of a brand, it’s only just the beginning of their customer journey. To retain customers, a company needs to know their expectations and make sure to fulfill them.
Check out these customer retention statistics to get a clearer picture of your clients’ needs:
- A whopping 88% of customers today have higher expectations than ever before (HubSpot)
- Nearly half (49%) of customers say they will most likely become a repeat consumer after a personalized shopping experience (Segment)
- Almost 80% of business leaders say customers spend more (34% more on average) when they get a personalized experience (Segment)
- A considerable percentage (64%) of Baby Boomers expect customer support to have access to the status of their most recent order (Epsilon)
- Nearly 76% expect consistent interactions across departments, yet 54% think sales, marketing, and customer service teams don’t share information (Salesforce)
- As many as 73% of customers want companies to understand their unique needs and expectations (Salesforce)
- A significant number (76%) of customers expect to engage with a customer representative immediately upon first contact with a company (Zendesk)
- All industries fall short of customer expectations by 38% (Hyken)
- Customer expectations for ease increased from 11% in 2013 to 90% in 2020 (Walker)
- When a customer has an issue, they expect (ASU):
- An explanation of why the problem occurred (43% of customers)
- Their money back (35% of customers)
- Product repaired/fixed (31% of customers)

Read more: Learn the distinction between customer support and customer service. Also, make sure to check out different types of customer service to choose the best one.
What’s important to customers?
Having satisfied clients is essential for any business to stay afloat and grow. But what is important to the consumers themselves? Find out from these statistics on customer service essentials:
- As many as 81% of customers say a positive experience with a company makes them more likely to get another purchase (Zendesk)
- Nearly 70% claim they made decisions to buy a product based on the quality of customer service (Zendesk)
- For 73% of clients, customer experience is an important factor in their purchasing decisions (PWC)
- A positive experience with a brand is more influential than great advertising for 65% of U.S. customers (PWC)
- For 48% of U.S. consumers, a friendly, welcoming service defines industry success (PWC)
- 71% of customers say company employees have a significant impact on their experience (PWC)
- 89% of clients say a quick response to the initial inquiry impacts the choice of the company they will buy from (Zendesk)
- For 71% of customers, the quality of customer experience is vital when deciding which company to purchase from (Salesforce)
- The most important elements of a good customer experience for almost 80% of American consumers are: speed, convenience, knowledgeable help, and friendly service (PWC)
- For 80% of customers, the experience a company provides is as important as its products and services (Salesforce)

Read more: If you’re looking for some real-life examples, be sure to read our customer service study to find out what makes a good customer experience.
Learn how to scale your customer service with AI
What do customers pay more for?
Customer service and convenience are the top things clients are willing to pay more for. Here are the numbers:
- As many as 63% of Gen Z would pay more for a good mobile experience (PWC)
- Among those who make under $50,000 a year, 50% are willing to pay more for exceptional customer service, versus only 19% who are unwilling (Hyken)
- Within a group of people who make over $100,000 a year, 66% report they’re willing to pay more versus around nearly 15% who are unwilling (Hyken)
- Almost 70% of customers would pay more for a convenient experience (Hyken)
- Over 90% of customers would pay extra for convenience in delivery (Hyken)
- More than 40% of customers would pay extra for same-day delivery (PWC)
- Only 15% of all customers would pay more for engaging design, and 12% would do so for a great atmosphere (PWC)

Read more: Learn more about the different types of customers you can encounter and how to meet their needs.
Customer success statistics
The progress of a company directly depends on customer success. Check out these customer satisfaction statistics for more info on the customer success program and how to improve it:
- 72% of organizations have a clearly defined customer success strategy (Regalix)
- The most popular metrics used by marketers to measure client success are (Regalix):
- Renewals for 68% of marketers
- The customer churn rate for 55 % of marketers
- Customer health score for 42% of marketers
- Customer referral rate (10% of marketers) and lifetime value (5%) are less popular metrics in measuring customer success (Regalix)
- 57% of marketers say that managing client expectations and measuring customer satisfaction (52%) are the biggest challenges success programs face (Regalix)
- 67% of marketers say that companies seek predictive analytics technology in customer success programs the most (Regalix)
- 87% of companies believe the customer success programs helped clients in adopting the products and services (Regalix)
- 82% of marketers run regular updates with clients as part of their customer success program (Regalix)
- Friendly, welcoming service defines success in an industry for 48% of U.S. consumers (PWC)

Read more: Learn all about the most crucial customer success metrics and KPIs.
Good customer service
What is considered excellent customer service nowadays? Here are some key good customer service statistics that will help you determine the goals you should implement into your strategy:
- As many as 62% of B2B customers purchased more after receiving a great customer service experience (Zendesk)
- For 69% of consumers, the speed at which their problem was resolved defines if customer service was good (Zendesk)
- Good customer service changes buying behavior for 87% of customers and increases the long-term revenue a company receives from them (Zendesk)
- A whopping 92% of customers are more likely to make a repeat purchase after a positive experience (Salesforce)
- More than one in three consumers (38%) state they will buy from a brand they’ve had a good experience with again, even if there are better options (Segment)
- The top 3 industries for the best service are (Hyken):
- Hospitality service
- Financial service
- Food service
- Top factors influencing good customer service (Hyken):
- Being treated like a valued customer (for 65.2% of consumers)
- Agents with strong knowledge or expertise (for 55.3% of consumers)
- Fast response time (for 53.5% of consumers)
- Nearly half (49%) of U.S. consumers say companies provide a good customer experience (PWC)
- Complainant satisfaction increases when companies add non-monetary remedies to monetary relief—43% were satisfied when a company only used financial remedies, 60% were satisfied when both financial and non-monetary remedies were used (ASU)

Read more: Check out the key reasons why customer service is important.
Customer onboarding
Essentially, the onboarding of clients is all about teaching them about your product to integrate it into their daily lives. Find out how many companies do it right by checking out these onboarding statistics:
- 78% of companies use live demos for customer onboarding (Regalix)
- Over 90% of customers think companies could do a better onboarding of new customers (Wyzowl)
- 88% of clients are more likely to stay loyal to a company with onboarding content that welcomes and educates them on the product (Wyzowl)
- 8 out of 10 users deleted an app because they didn’t know how to use it (Wyzowl)
- 55% of people returned a product because they didn’t understand how to use it (Wyzowl)
- 63% of customers sees onboarding as an important factor in their buying decisions(Wyzowl)
- 69% of people think that companies could improve onboarding by implementing more videos (Wyzowl)
- 97% of customers say that a video is an effective tool for the customer (Wyzowl)

Bad customer service statistics
Good customer service shouldn’t be considered as a cost. It’s an investment. Always have in mind that your clients are the ones who pay your bills. Bad customer experience may cause tragic consequences for your business. You can lose your money, reputation and, most importantly, clients. To prevent these from happening, take a look at the following stats:
- 96% of customers leave a brand because of bad customer service (Hyken)
- 60% of customers would stop buying from a brand if they received an unfriendly service (PWC)
- 66% of customers stop buying from a brand because of a poor customer service experience (Zendesk)
- 79% of high-income households avoid brands for at least two years after a bad experience (Zendesk)
- Explaining a problem to multiple people makes customer service interaction bad for 72% of customers (Zendesk)
- 61% of customers say they would switch to a company’s competitor after a single bad customer service experience (Zendesk)
- 74% of clients say they will forgive a company if they make a mistake after receiving excellent service (Zendesk)
- Factors influencing poor customer service (Hyken):
- Almost 49% of customers say rude representatives influence poor customer service
- Around 42% of consumers say not being treated like valued customers influences whether a company has bad customer service
- Almost 42% of customers say lack of knowledge from the representative influences their bad experience
- 46% of all customers stop doing business with a brand if the employees are not knowledgeable (PWC)

Read more: Discover easy steps that will help you learn how to deal with angry customers.
Customers’ frustrations
What do people get most annoyed by? Check out the most common situations when your customers may reach a boiling point:
- The most frustrating aspects of poor customer service are (HubSpot Research):
- Having to wait on hold (for 33% of customers)
- Having to repeat themselves to different customer representatives (for 33%)
- Customers are frustrated when (Segment):
- The shopping experience doesn’t change after negative feedback (81% of consumers)
- The company gets the name wrong in brand communication (76% of consumers)
- The online shopping cart doesn’t connect to a mobile app (66% of consumers)

Read more: Learn different ways in which you can handle customer complaints.
Communication with customers
Companies need to talk to customers through the right channels and at the right frequency. What else is important to know about customer communication? Find out more by checking out these statistics:
- When it comes to the topic of frequency and channels (twilio):
- 42% of customers visited the website
- 34% made a purchase (40% of Millennials purchased a product as a result of being communicated in the way they prefer)
- 31% had a higher opinion of the company
- 17% recommended the business
- 15% posted a positive review
- 70% of consumers have penalized a business for using the wrong frequency and channel. From those (twilio):
- 41% of customers unsubscribed
- 30% of consumers had a lower opinion of the company
- 19% of shoppers stopped doing business with the company
- 83% of consumers prefer to use email for communication with a business, but for more urgent communications, text is preferred 2.5 times more (twilio)
- Most people immediately want to receive communications related to a change of their plan (63%), delivery notifications (56%), and appointment reminders/confirmations (54%) (twilio)
- Most important factors when customers communicate with a business (twilio):
- 54% want to easily opt out of receiving messages
- 52% want to choose the ways they receive communication
- 49% want only to receive messages when they’ve opted in
- 94% of consumers are annoyed by communication from businesses (twilio)
- 41% of customers don’t remember opting in (twilio)
- 7 in 10 consumers prefer receiving messages about promotions once a week or more (twilio)
- Customers prefer to be contacted by a business in the afternoon (39% of customers) and in the morning (32%) (twilio)

Interactions with customers
Most consumers don’t feel that customer service reps understand their needs. Here are some key statistics on interactions between a company and a client:
- 64% of U.S. consumers and 59% of consumers worldwide think companies don’t understand the human element of customer experience anymore (PWC)
- Even after all advances in technology, 55% of customers think we will still need support agents for positive customer experiences (PWC)
- 75% (PWC) want to interact with a human more as technology improves, and 70% prefer to interact with a human agent in general (Epsilon)
- Only 38% of U.S. consumers and 46% of consumers outside the U.S. state that customer service employees understand their needs (PWC)
- Since 2018, customer service interactions in-person fell by 16% (from 89% to 75%), video support increased by 42% (from 32% to 46%), and the online chat/live support increased by 35% (from 50% to 67%) (Salesforce)
- 79% of service representatives need to have a view of previous customer interactions to provide great service (Salesforce)
- 77% of customers were satisfied with their last interaction with a company (Hyken)
Automation of customer communication
What activities do companies automate? And what do customers think about automated experiences? These automation and live chat statistics will give you a better understanding of increasingly automated customer service:
- 67% of organizations use chatbots (Salesforce)
- Activities that are mostly automated by companies (Salesforce):
- 67% of basic information gathering
- 65% of obtaining customer feedback
- 63% of case classification
- Automating routine tasks allows 77% of agents to focus on more complex work (Salesforce)
- Only 3% of U.S. consumers want their experiences to be as automated as possible (PWC)
- 85% of large support teams aren’t using artificial intelligence (Epsilon)
- Only 47% of executives say they understand clearly how robotics and artificial intelligence will improve customer experience (PWC)
- Companies use AI to (Zendesk):
- Make recommendations based on their purchase or search history (50%)
- Engage with customers through their preferred contact methods (40%)
- Prioritize customers according to their status or account type (39%)

Read more: Check out some of the top customer service software you can use for your business. We also recommend looking into the latest AI statistics.
Service channels
Customers use a variety of channels when looking for assistance. Hardly anyone will use less than three channels in their search for answers. Find out more about it from these customer engagement statistics:
- 98% of customers use FAQ, help center, or other self-service online resources (Zendesk)
- 74% of customers use multiple channels to complete a transaction (Salesforce)
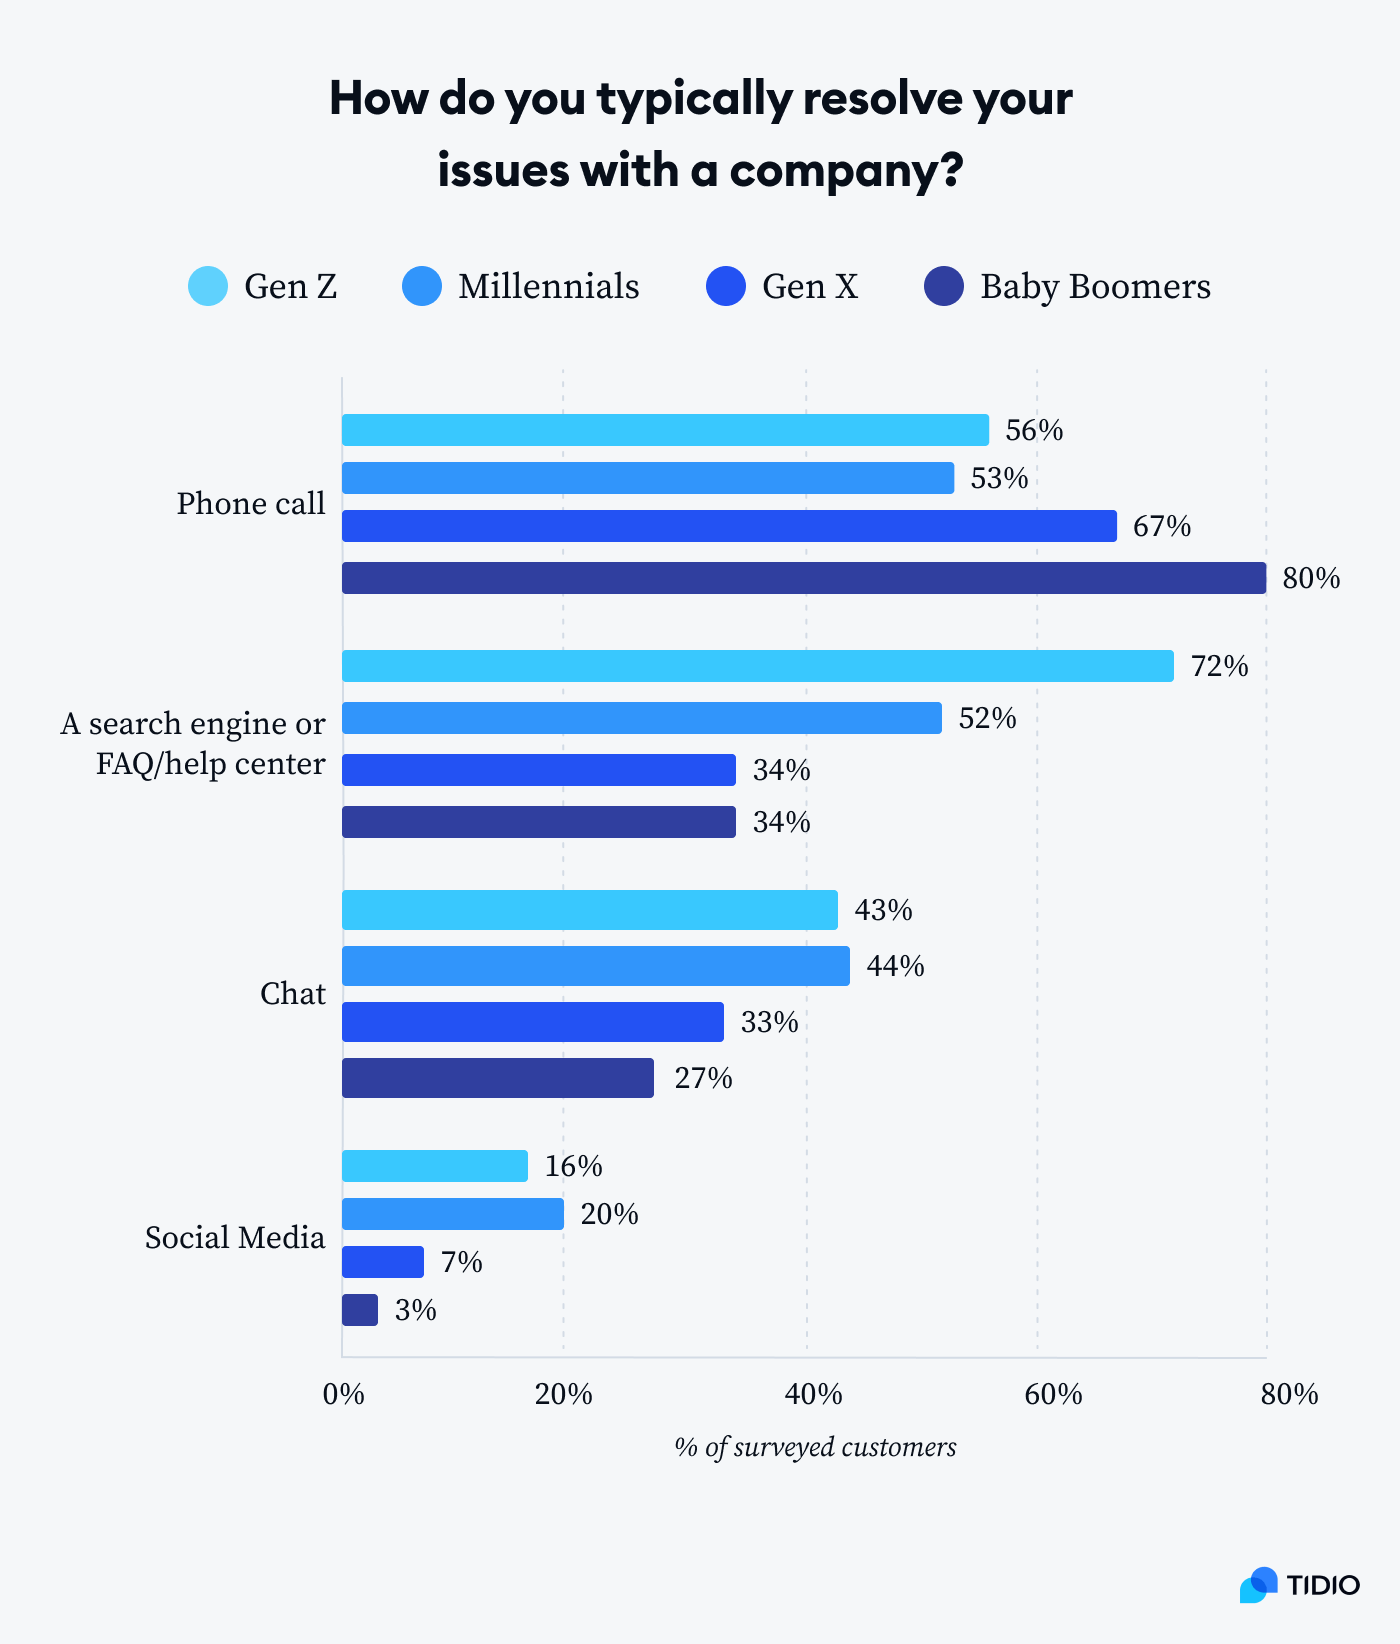
- The easiest way of communication for 67% of customers under the age of 40 is texting (Hyken)
- For 66% of customers over the age of 40, the easiest way of communication is by telephone & email (Hyken)
- Most customers prefer email (88%) and phone (80%) as engagement channels (Regalix)
- Social media (12% of customers) and website (10% of customers) are the least-preferred customer engagement channels (Regalix)
- Companies prefer using email (88% of companies) and phone (80% of companies) for communicating with existing customers (Regalix)
- Phone support and live chat have the best customer satisfaction ratings (91% and 85%), winning over help centers (83%) and email support (82%) (Zendesk)
- Agent consoles or computers are used for handling most (54%) customer calls (Salesforce)
- 69% of customers say they would interact with a bot on simple issues, which is a 23% increase from the previous year (Zendesk)
- More than 70% of customers expect conversational care experiences when they engage with companies (Zendesk)
- More than two-thirds of consumers over the age of 40 are expecting conversational engagement with a company (Zendesk)
- 57% of customers prefer engagement through digital channels, while 53% prefer to buy products online vs in-store (Salesforce)

Read more: Learn how to make a customer satisfaction survey in no time.
Self-service
Most consumers expect a brand to have an online self-service portal. The statistics below illustrate all you need to know about customer self-service:
- 35% of consumers, on average, find the self-service option highly important (Emplifi)
- 65% of customers prefer self-service for simple matters (Salesforce)
- Over 69% of customers prefer to solve issues on their own, while 63% almost always start with a search using a company’s online resources (Zendesk)
- Here are customers’ expectations when it comes to self-service: (Vanilla Forums):
- 79% expect organizations to provide self-service support tools to help customers find answers without contacting support
- 77% see organizations in a more positive light if they offer self-service options
- 83% would use an online community for self-service support

Social media customer service statistics
Social media is growing in size every year. These social media customer service statistics unveil customer behavior online:
- 67% of customers find it convenient to contact customer service on social media (Zendesk)
- 76% of clients expect to get a reply within 24 hours on social media (Sproutsocial)
- Customer inquiries over WhatsApp, Facebook Messenger, and WeChat or Line jumped 36% in 2021, which is higher than any other channel (Zendesk)
- The most common reason why users seek out a company’s customer service on Twitter are (Sproutsocial):
- Product defectiveness (43%)
- Order issues (29%)
- Poor in-person experiences (29%)
- When it comes to customers who use Twitter (Sproutsocial):
- 53% of users find it helpful when brands answer questions quickly
- 51% report they feel more favorable toward a brand that communicates with them on Twitter
- 1 in 3 (34%) of users on Twitter bought a product or service after a positive customer service exchange on that network

Where else do people search for information?
If you don’t give your customers all the information they need, they’ll search somewhere else for them. Look at these customer statistics to discover where consumers search for answers outside the brand’s website:
- 98% of customers search for the answer on the company’s FAQs and help center before they contact customer service directly (Zendesk)
- Customers use videos to understand how to use a new app (74%) and how to use a physical product (91%) (Wyzowl)

Consumer behavior
What are the most important facts you need to know about the customers? These consumer statistics will give you all the info you may need on the topic:
- 65% of households experienced customer service difficulties in 2020 (an increase from 56% in 2017) (ASU)
- 84% of customers are more likely to buy from sales reps that understand their goals (Salesforce)
- 34% of consumers stop buying from a brand because the quality of the product or service went down (Morning Consult)
- In 2022, 59% of customers trusted the brands they interacted with, which is 2% higher compared to 2020 (Forrester)
- The experiences with one industry influence the expectations for others for 62% of customers (Salesforce)
- Receiving a discount within an hour of interaction with a brand drives loyalty for 63% of customers (Segment)
- Reliability and durability drive loyalty for 92% of customers (Morning Consult)

Read more: Find out how to increase customer loyalty and learn all about customer retention and its best strategies.
Personalization
Everyone is unique and wants to be treated that way. So, it’s no wonder personalization is appealing to the majority of customers. Discover everything you need to know about personalization with these customer satisfaction statistics:
- 62% of consumers say a brand is going to lose loyal customers if they don’t offer a personalized experience in the future (Segment)
- Personalization is appealing to 90% of customers (Epsilon)
- Nearly half (49%) of customers say they will likely become repeat buyers after receiving a personalized shopping experience (Segment)
- 52% of customers expect the offers to always be personalized (up from 49% in 2019) (Salesforce)
- Expectations for a customized experience increased from 4% in 2013 to 88% in 2020 (Walker)
- 60% of customers list trustworthiness and transparency as vital brand traits (Segment)

Impulse buyers
Who is more likely to buy products on impulse? These customer statistics will give you a perfect insight into the behavior of impulse buyers:
- The average person spends $314 per month on impulse purchases (Cision)
- More than half of consumers (52%) are impulsively buying both online and in-store (Cision)
- While shopping for products on their phones, 7 in 10 customers are more likely to spend impulsively while lying in bed (Cision)
- Two in three customers (67%) have made an impulse purchase due to the fear of missing out (Cision)
- More than half (58%) of customers report impulse shopping has helped them save money (Cision)

Personal information
Most customers don’t want to share their personal data with a company unless they trust it or value its service greatly. The reasons why they don’t like to share data include a lack of awareness about how this info will be used. There are also concerns about trust, privacy, and security as a whole.
The statistics below will give you more insights into what customers expect, so you can know what to work on. Check them out:
- How much a customer trusts a company determines how much they’re willing to share their personal information (true for 88% of U.S. consumers) (PWC)
- 63% of customers would be more willing to share their data for a service they truly value (PWC)
- Only 27% of customers completely understand how companies use their personal information, and 86% want more transparency (Salesforce)
- 61% of customers feel like they’ve lost control over how their personal information is used (Salesforce)
- 43% of U.S. consumers say they would not permit companies to collect their customer data (PWC)
- Only 40% of customers trust brands to keep their personal data safe and use it responsibly (Segment)

Feedback
Oftentimes, people are willing to provide feedback to companies right after interacting with them. Receiving customer feedback is important as it can only help you improve retention and provide the best experience possible for your clients.
Find out more about customer feedback with these customer experience statistics:
- 58% of customers felt like their complaint was ignored (ASU)
- 30% of companies respond to customer feedback (Hyken)
- 59% of companies provide surveys for customers to get their feedback (HubSpot)

Read more: Learn more about the voice of the customer and how it can benefit your business.
Online reviews
To decide what brand to go with, most consumers first go online and check out the reviews. People usually look up reviews since they appreciate the valuable input from other people who have already tried certain products and services. Plus, it’s only further proof of a company’s credibility.
Check out these customer experience stats to find out more:
- Online customer service reviews influenced 88% of customers when making a buying decision (Zendesk)
- 95% of customers share a bad experience with others (95%), and 87% share a good customer service experience (Zendesk)
- 58% of customers are more willing to tell others about customer service experiences now than they were five years ago (Zendesk)
- 85% of service professionals believe that customers are willing to share positive and negative experiences with others more than ever (HubSpot)
- 48% of customers check reviews on social media when deciding on a product purchase (ASU)
- 67% of customers recommend products or services to others after a great customer experience (Zendesk)
- 73% of consumers only pay attention to reviews written in the last month (Brightlocal)
- 20% of customers expect a response within a day after writing a review (Brightlocal)

Read more: Explore essential customer experience statistics and stay up to date with customer service trends.
Companies’ strategies
What are the top business objectives? It’s always a good idea to look up the best players in the industry to stay on top of your game. Check out how other companies invest in customer service to improve your own strategy:
- Companies using APIs (Application Programming Interface) are 21% faster in solving customers’ problems (Epsilon)
- Customers of companies using APIs spend 35% less time waiting for responses (Epsilon)
- Big companies are twice as likely to offer customer service training (42% compared to 21% for smaller companies) (Epsilon)
- Top 3 business objectives (Regalix):
- 66% want to reduce churn
- 65% want to increase product usage
- 57% want to increase renewals
- 61% of companies don’t reward customers for referrals (Regalix)
- 79% of companies invest in training of their support agents (Salesforce)
- 88% of customers think companies should hire people who reflect the community (Salesforce)
- 80% of managers say field service drives significant revenue (Salesforce)
- 75% of mobile workers say field operations connect to core service at their organization (Salesforce)
- 40% of companies see customer service as an expense, not a growth opportunity (HubSpot)
- 37% are in the process of implementing conversational customer service (Zendesk)
- 34% have already implemented conversational customer service and 14% are planning to implement it this year (Zendesk)
- 8% are not interested in implementing conversational customer service, while 7% would like to implement it, but don’t have concrete plans to do so (Zendesk)
- To help the customer service team, companies use (HubSpot):
- Help desk system (42% of companies)
- Knowledge Base/ FAQ (40% of companies)
- Shared email alias (37% of companies)

Customer-centric approach
About 95% of companies claim to be customer-focused, but how many of them tailor their services to customer needs? These customer service stats show what companies do to stay focused on their clients:
- 50% of companies tailor their products and services to the needs of clients (Hyken)
- 30% of companies focus on delivering exceptional customer experience (Hyken)
- Companies state that developing a customer-centric culture (46%) and simplifying products & processes (45%) are the best strategies to meet the needs of the clients (Walker)

Local businesses
Most consumers search for local businesses online and leave reviews after their visit. Consumer statistics on local businesses below will tell you more:
- 93% of consumers use the internet to find a local business, with 34% searching every day (Brightlocal)
- 87% of consumers read online reviews for local businesses (Brightlocal)
- 72% of US consumers write reviews for local businesses (Brightlocal)

Tracking & measuring of customer service
Tracking your results enables you to catch errors and quickly react to improve. But do companies use their customer service metrics or go with the flow? These statistics will help give you more insight into what you can do to improve the measuring of your customer service:
- 57% of companies don’t track the customer lifetime value (Regalix)
- Companies track:
- Customer satisfaction (87% of companies) (Salesforce)
- Customer reviews on social media (63% of companies) (Regalix)
- Customer Net Promoter score (23% of companies) (HubSpot)
- In 2020 (Salesforce):
- 80% of companies tracked revenue (up from 51% in 2018)
- 79% tracked customer retention (up from 57% in 2018)
- 56% tracked deflection (up from 36% in 2018)
- 5 most important service key performance indicators (Salesforce):
- Customer satisfaction
- Revenue
- Customer retention
- Customer effort
- SLA performance
Read more: Find out key case deflection tactics to use for improved customer satisfaction.

Customer service representatives
What do customer service representatives deem as most important, and what are their priorities? Check out key statistics related to this topic to learn more about their opinions, wants, and values:
- 97% of representatives who see their companies as cool think they’re transparent, yet only 64% of customers who see their companies as transparent also view them as cool (Bi WorldWide)
- 80% of customer service representatives value their organization’s mission, and 88% agree their job is important (Bi WorldWide)
- Speed and quality are equally important for 68% of service representatives (Salesforce)
- 77% of companies view service agents as customer advocates (Salesforce)
- According to 89% of service representatives, the phone will always be used for customer service, with 76% of service professionals preferring the phone for complex cases (Salesforce)
- 68% of agents feel more satisfied when helping clients with complex issues (Epsilon)
- The three most important skills for customer service and support staff are communication, listening skills, and product knowledge (Salesforce)
- Only 10% of service employees want to leave service jobs within the next 5 years (HubSpot)
- A whopping 43% of agents and 51% of high-growth and low-growth companies said that their biggest challenge is not having enough time in the day (HubSpot)
- Service teams’ top priorities when it comes to customer experience tools are (HubSpot):
- Automated ticketing systems that would eliminate time spent filtering
- Knowledge bases, chatbots, and other tools to help clients answer questions
- CRM software to streamline customer management

Happy vs. unhappy employees
Happy employees often mean happy clients. When your employees are satisfied with their work, they put in extra effort and try even harder. This has a positive effect on how consumers look at your brand and the service they receive. The following statistics show why employee happiness is important for a business:
- 75% of service employees are happy with their current job (Bi WorldWide)
- 90% of happy employees agree they feel an obligation to work as hard as they can for the organization (Bi WorldWide)
- 93%% of satisfied workers are willing to put in extra effort to provide superior service for the clients. Among unhappy employees, the figure drops to 69% (Bi WorldWide)
- Companies with happier employees show 147% higher earnings per share than their competition (Gallup)
- 54% of unhappy workers plan to leave in the next 12 months, and there are only 23% of those who are happy at their current service job (Bi WorldWide)
- 91% of employees whose managers understand them are happy with their current jobs, and those who are happy are 9 times more likely to be performing with greater intensity. They are also 13 times more likely to recommend their organization as a great place to work and 8 times more likely to say working there brings out their best ideas (Bi WorldWide)
- Employees working at cool organizations are 15 times more likely to be happy with their current jobs (Bi WorldWide)
- Agents need: (Zendesk)
- Manageable workloads (only 15% of representatives are highly satisfied with their working amount)
- More training (62% think skill-based training would boost their performance)
- Better performance metrics (14% report being happy with work evaluation metrics)
- Clear advancement opportunities (only 14% are happy with their career path)
- More respect (38% wish to be valued as the rest of the organization)
- Agents are satisfied with: (Zendesk)
- Quality of their training (20%)
- How their team is perceived by the rest of the company (17%)
- The ability to make suggestions (17%)
- Their training frequency (17%)
- Overall workload (15%)
- Career path options (14%)
- Metrics used to measure their performance (14%)

Employee performance
The performance of customer service employees depends on several factors. Find out more about employee performance with these statistics on customer service:
- 88% of high performers have clear guidelines on how flexible they can be with clients compared to 46% of underperformers (Salesforce)
- 86% of high performers feel encouraged by management to be flexible with customers compared to 40% of underperformers (Salesforce)
- 83% of high performers received training on how to be empathetic with clients compared to 44% of underperformers (Salesforce)
- 55% of service agents need better training (Salesforce)
- 57% of customers think sales reps often lack sufficient knowledge of the business (Salesforce)

Miscellaneous stats
From proactive customer service to customer retention rates and other important data, you can discover it all with these customer service statistics:
- 67% of customer service teams proactively reach out to clients (Epsilon)
- Gen Z (49%) and Millennials (59%) are more likely to try out new products (Morning Consult)
- A 5% increase in customer retention produces more than a 25% increase in profit (Bain & Company)
- The average repeat customer spends 67% more in months 31-36 of their shopping relationship than the first-time buyer (Bain & Company)
- 30% of customers leave sites because they can’t find what they are looking for and abandon shopping carts (Bain & Company)
- 80% of companies believe they provide superior service, yet only 8% of companies have clients who agree (Hyken)
- Customer service/support (49% of CX professionals), market research (37%), and marketing (35% of CX professionals) are the most effective areas for taking actions related to customer service (Walker)
- For 71% of clients, employees have a significant impact on the customer experience (PWC)
- 88% of service teams share common goals and metrics with sales teams (Salesforce)

The pandemic changed customer service
It’s no secret that COVID-19 has changed the lives and realities of millions of people. It also changed customer service in more than a few ways. Check out these consumer statistics and get informed about how the pandemic has influenced customer service:
- 88% of customers expect companies to speed up digital initiatives due to Covid-19 (Salesforce)
- 69% of customers think companies should provide new ways of purchasing their product because of the pandemic, as well as offer new products and services (54%) (Salesforce)
- 48% of clients claim the pandemic has raised their customer service expectations (Zendesk)
- According to 78% of service professionals, customers used self-service more during the pandemic (Salesforce)
- 54% of companies had a higher volume of tickets during the pandemic (Salesforce)
- 88% of companies changed policies for more flexibility to clients during the pandemic (Salesforce)
- According to CX professionals, the pandemic has changed (Salesforce):
- Workflow and processes (84% of CX professionals)
- Technology needs (81% of CX professionals)
- How companies engage customers (73% of CX professionals)
- 81% of service professionals agree that customers became more anxious during the pandemic. On top of that, 75% say clients became more demanding and present more complex cases (Salesforce)

Customer service statistics—Key takeaway
And that’s it— some of the most important statistics about customer service you can find on the web.
We hope the statistics we’ve compiled here will come in handy. Keep visiting us regularly as we’ll be updating them to keep up with the trends.
Sources:
- Customer journey needs statistics
- Customer Onboarding Statistics 2020
- CUSTOMER SERVICE AND BUSINESS RESULTS: A SURVEY OF CUSTOMER SERVICE FROM MID-SIZE COMPANIES
- Customer Service and Customer Experience Report
- Customer service is worse than ever and so is consumers’ rage
- CUSTOMERS 2020: A PROGRESS REPORT
- Employee Motivation in the United States
- Experience is everything: Here’s how to get it right
- Global State of Customer Service
- Global study: Consumer engagement best practices for 2020
- Local Consumer Review Survey 2020
- New Epsilon research indicates 80% of consumers are more likely to make a purchase when brands offer personalized experiences
- Prescription for Cutting Costs
- State of customer success
- STATE OF SERVICE
- The State of Customer Service in 2020
- The Value of Online Customer Loyalty and How You Can Capture It
- What Are Customer Expectations, and How Have They Changed?
- WHAT DRIVES BRAND LOYALTY TODAY
- What is the impact of customer service on lifetime customer value?
- Zendesk Customer Experience Trends Report 2020
- The State of Customer Service in 2022 [HubSpot Data]
- Twilio’s 2022 State of Personalization Report
- Salesforce Report: Nearly 90% Of Buyers Say Experience a Company Provides Matters as Much as Products or Services
- Zendesk CX Trends Report 2022 – Challenges
- Salesforce State of the Connected Customer 4th Edition
- Live Chat Exposes a Fatal Flaw in Your Go-to-Market
- Zendesk research: customer satisfaction
- Zendesk CX Trends Report 2022 – Growth Areas
- The social media customer service statistics brands need to know in 2022
- Forrester’s US 2022 Customer Experience Index: Nearly 20% Of Brands See Drop In Customer Experience Quality – Forrester
- 15 Customer Self-Service and Experience Stats To Know (2020) – Vanilla Forum
- Emplifi Consumer Expectations Report
- Zendesk CX Trends Report 2022 – AI and automation
- Connect employee engagement with performance – Gallup
- Americans Have Increased Their Impulse Spending by 14% in 2022 Compared to 2021, According to Annual Survey Commissioned by Slickdeals