What is the tree structure of a chatbot?
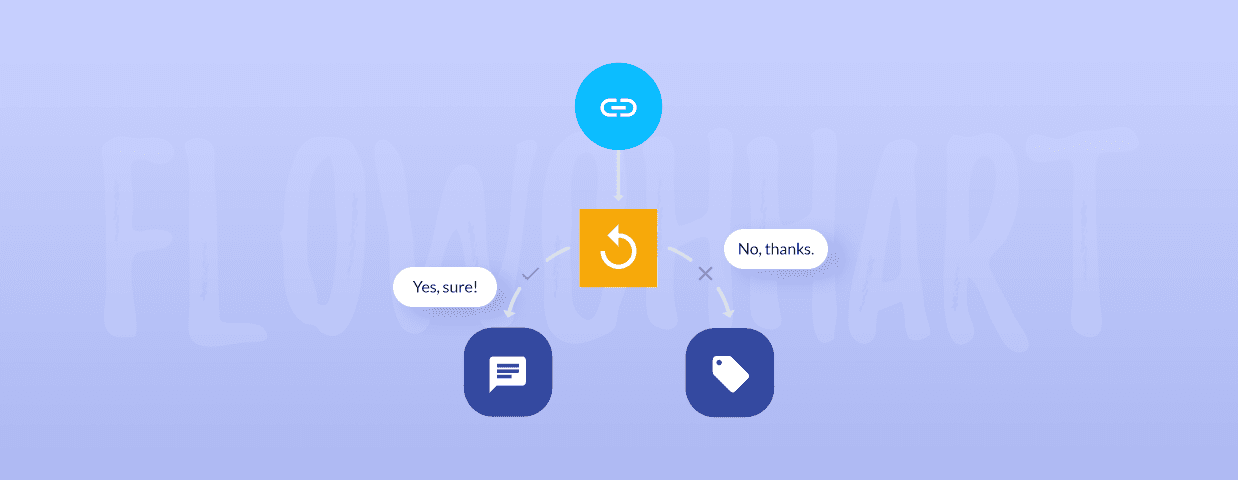
A chatbot flowchart.
If we tried to boil chatbots down to their basic components, they would turn out to be little more than decision tree diagrams (flowcharts) equipped with a conversational user interface.
To make great chatbots that will help boost your business, you should be able to understand how they operate. Comprehensive knowledge of decision trees and flow maps is a must!
Don’t worry if you are not technically inclined. “Designing conversational flow maps” may sound intimidating, but it is just a fancy way of saying “drawing flowcharts.”
Design chatbots and conversations with the best visual bot editor
Let’s jump right in.
What is a chatbot flowchart?
Chatbot flowchart is a diagram that represents actions and steps that follow a logical and sequential order. These flowcharts determine the bot’s messages and the overall conversation with the visitor that will take place in real time.
Check out this funny flowchart example:

Reading the diagrams like the one above is intuitive and you don’t need any experience to understand what’s going on immediately. And they’re easy for your chatbot software to understand and follow.
Within the chatbot flow diagram, there are arrows and special nodes that affect the direction of the flow with specific conditions dependent on the user responses. For example, the chatbot may ask a question with A and B answer options, and separate routes have to be taken in each scenario.
And here’s how a chatbot flowchart looks in real life for comparison:

Read more: Chatbot frameworks, like Microsoft, are the opposite of a visual bot builder when it comes to creating conversational flowcharts. Discover all about them.
Now—how do you make a chatbot flowchart?
Let’s find out.
How to design a chatbot conversation flow?
It’s really not as complex as it seems. You can create the flow of the chat on paper and, once you choose the platform you want to use, transport the drawings onto it. And that logic works even when using more advanced technology like artificial intelligence (AI) and natural language processing (NLP) chatbots.
Just follow these four steps to design the conversational flow:

1. You can start with pen and paper and draw your flowchart
Before you use bot-building software, you can try to design the flowchart with traditional tools. Go through the frequently asked questions your website visitors are asking and draw flowcharts answering each of them.
Just ensure to use consistent shapes for all of your chatbot conversational flow.

Use sticky notes on a whiteboard or draw diagrams with a pencil in a notebook. This way, you won’t have to struggle with mastering the user interface of a given tool. And, you’ll be able to focus on the design and devote your full attention to the problem you want to solve.
2. Mind the direction of the flow
Have you ever heard of Rube Goldberg machines? They are built with random objects that create a domino effect—a tennis ball lands on a lever, the lever triggers a spring which shoots a bowling ball, the bowling ball lands into a bucket which is attached to a string, the string pulls a handle, and so on and so forth.

A flowchart is somewhat similar to Rube Goldberg’s devices. You should be really careful about keeping track of what goes where and how it affects the overall course of action. One faulty element and the machine stops working well.
Did you know that…
Chatbots can solve over 70% of customer service queries on their own. On top of that, nearly 70% of shoppers use chatbots.3. Avoid flowchart dead-ends
Make sure that you can move freely through your flowchart and eventually reach one of the finishing nodes. It should be clear whether you should take another action, return to one of the previous steps within your diagram, or that it’s the end of the line, so to speak.
Also, there shouldn’t be any orphaned, dead-end points. People going through your chatbot decision tree shouldn’t be confused and they should always know what to do next.
For example, when there are three options the user can click on, each one should lead to a finishing node and not be left out, like here:

4. One decision bot = one topic
Sometimes flowcharts and bot decision trees can become very complex. If your flowchart appears overtly complicated, it may be wise to break it down into several subtasks, each with a separate flowchart.
A “simple” chatbot decision tree algorithm with just seven Yes/No questions can easily produce as many as 128 different scenarios. You should remember to stick to the main “trunk” and the most important branches of your decision tree, without getting caught up in details.
And if it becomes too convoluted, create a separate flowchart.

Read more: Once you create your AI chatbot flowchart, you should start training your bot in order to provide users with a better experience.
Now—
Let’s look at some chatbot conversation flow examples for better understanding of these diagrams.
Chatbot flow examples
Rule-based chatbots use conversation flows—carefully designed flow maps that take into account all possible conversation outcomes and user input.
Remember that chatbot flowcharts should be as simple as possible.
The more user decisions and steps they involve, the more chatbot dialogue options you have to predict and script. And the more complicated the process becomes for your users.
Most chatbots combine flowcharts and solutions that resemble regular decision trees. See this example of an ecommerce chatbot, powered by Tidio, that handles product returns from customers:

Tidio’s editor can be used as a chatbot decision tree maker.
You can use one of the available bots to get the right chatbot flow templates and customize them. In the chatbot editor, you can also start from scratch to easily create a decision tree template and fill in the blank messages.
Let’s try to analyze another example chatbot flowchart.

As you can see, designing a chatbot decision tree diagram and turning the flowchart into a working conversational AI is not that difficult.
Read more: You can also design diagrams for your social media bots. Discover how to make your Facebook Messenger chatbots.
To be even more specific—
Here’s an explanation of chatbot diagrams in a decision tree form.
What is a chatbot decision tree?
A chatbot decision tree is a type of diagram or flowchart that branches into multiple decision paths through different questions.

Decision trees, or tree diagrams/charts, are named for their look and structure. They are similar to upside-down trees with branches that grow into more branches that end with a leaf node.
Create your chatbot flowcharts easily with Tidio’s visual bot builder
Did you know that…
Study shows that chatbots help to increase sales for a business by an average of 67%.How to create a decision tree?
Chatbot decision tree diagrams are similar to flowcharts, but their structure is more straightforward. If you want a deeper look at how to structure branches, nodes and outcomes effectively, this guide on how to make a decision tree breaks the process down step-by-step. A decision tree begins with a single question. There are follow-up questions based on the previous choices, and the structure ends with specific nodes.
A node, as opposed to a branch, usually offers a solution and ends the diagram structure, as there are no more elements to follow.
Read more: Go through the simple steps on how create add a chatbot to your website.
For a visual representation and to make things easier for you—
Let’s have a look at some of the most commonly used templates of conversational flows.
Chatbot conversation flow templates
By using a chat flow diagram tool, you get a number of premade rule-based and AI chatbot flowchart templates. They come for a variety of bot use cases, and you can customize them to your business needs. This allows you to determine and set a high bar for the user experience after clicking on the chat widget.
Here are the three most common chatbot dialogue examples:
FAQ chatbot decision tree

This chatbot flowchart template is designed to answer frequently asked questions (FAQs) in the least amount of time and effort from the customer’s side. It helps your business be available for visitors at any hour of the day or night. FAQ chatbot flowchart can improve customer satisfaction with your brand and increase their trust as the client will know that you’re always there for them.
Read more: Learn all about Tidio chatbot templates including how to edit and test them.
Lead generation conversation flow chart

When you want to collect leads for your marketing campaigns, this conversation flow diagram is for you. Once customized and activated, this bot’s job is to gather user’s data, like name and email address, through a chat. And because it’s done in a conversational manner, it’s not pushy and doesn’t detract from your brand.
Read more: Discover how Procosmet used Tidio to boost lead generation in this case study.
Chat flow chart for saving carts

This chatbot flowchart example is for companies looking to increase their sales and slash abandonment rates. Oh wait… That’s every company.
Once you activate this bot, it will detect the user’s cursor leaving the page and will send them a message about the items in the basket. It can also offer a discount and create a FOMO effect for additional encouragement.
Read more: Go through the chatbot templates showing the most useful decision tree chatbots for your business.
Chatbot flow charts: key takeaway
Chatbots are an indispensable element of modern ecommerce customer service. Being able to design them is a huge asset to your business.
Chatbot workflow diagrams can be of great help to create chatbots that prevent shopping cart abandonment, boost your conversion rate, and increase the quality of customer experience.
Remember that:
- Chatbots are just like interactive flowcharts, so the same design rules apply
- Nodes within your flowcharts should follow a logical sequence
- Your flowchart must be easy to read and not too complex (divide it into several separate flowcharts if you need to)
- Your flowcharts and decision trees should always end (however, you can influence what steps one has to take to reach the final node)
- You can map your design with pen and paper and use a flowchart maker of a bot editor later on
- You can use ready-made templates and adjust them according to your needs
All in all, you should definitely give it a try and create your own chatbot flow maps from scratch or by modifying the existing ones.