The latest research by the Baymard Institute states that nearly 70% of ecommerce carts get abandoned. This means that almost 70 out of 100 potential customers give up before making their purchase.
Quite frankly, that’s a lot of wasted sales opportunities.
So, we’ve compiled a list of the most relevant shopping cart abandonment statistics backed by research to help you figure out why customers don’t complete their purchases.
You can also use this data to learn how to improve the most common mistakes, boost your conversions, and entice more visitors to buy from you.
In this article:
- Key cart abandonment statistics
- Reasons why carts get abandoned
- The impact it has on your business
- Solutions to shopping cart abandonment
- Conversion rate statistics
- Add-to-cart rate statistics
- Sources
Learn how to decrease your store's cart abandonment using AI customer service
Interested in reading more about increasing ecommerce sales? Make sure to check out these articles:
- What Is Ecommerce Automation and How to Use It?
- 26 Ways to Increase Online Sales for Ecommerce Stores
- How to Build Trust in Ecommerce
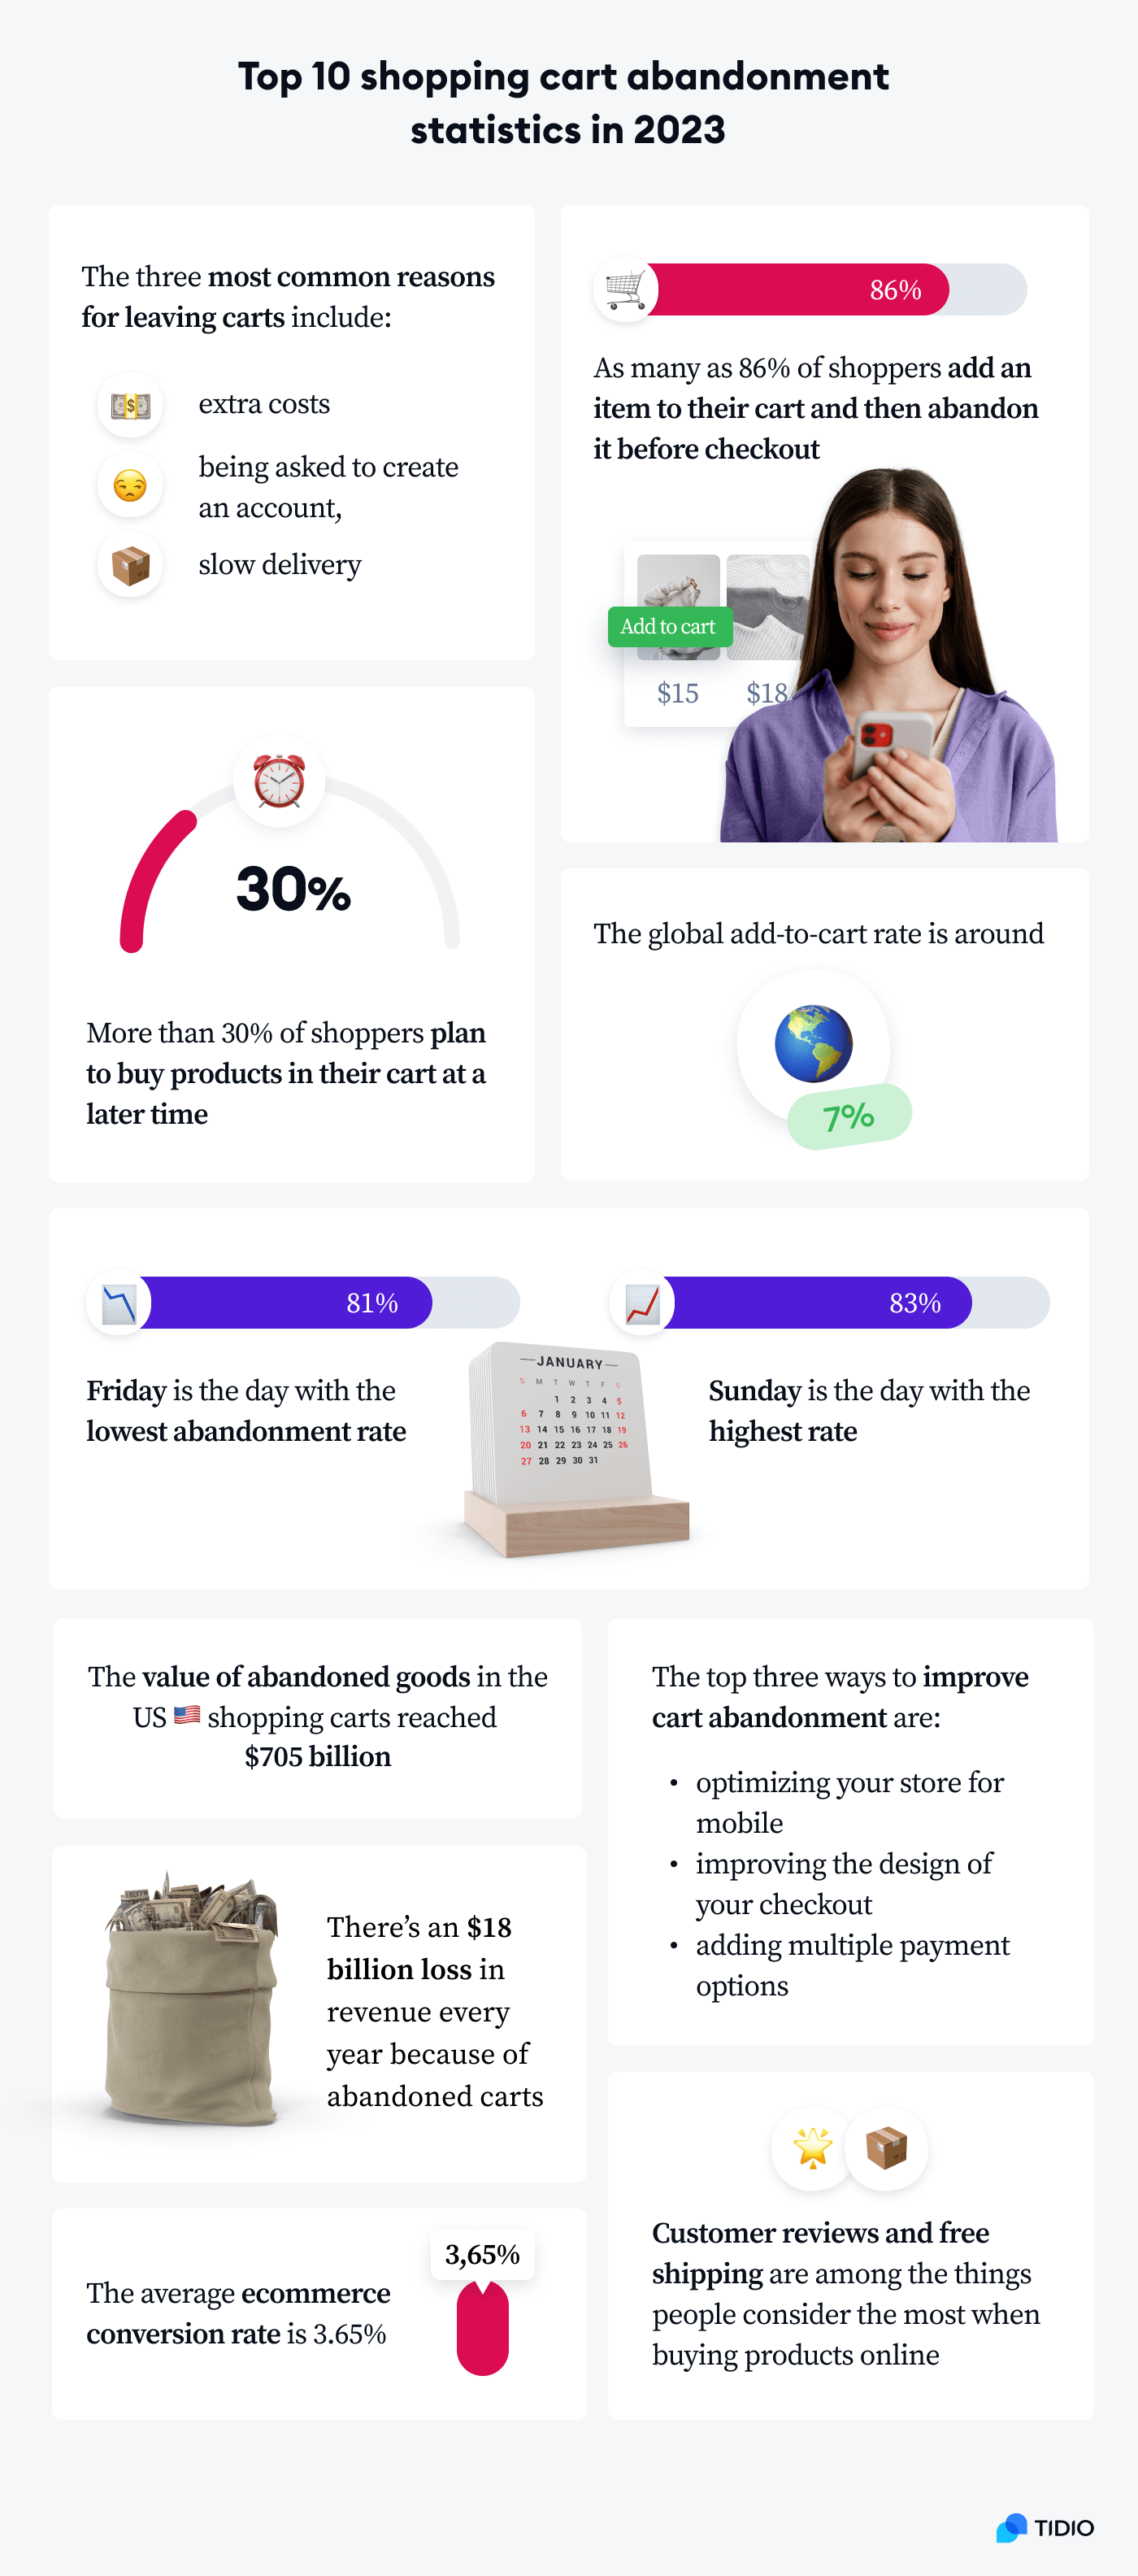
Before we go more in-depth, check out the top 10 cart abandonment statistics:
And now, let’s explore all the statistics in more detail.
Essential shopping cart abandonment statistics
As we’ve established in the beginning, the average shopping cart abandonment rate across all industries is almost as high as 70%. Even though this percentage can vary from year to year, it’s still a major topic of concern for everyone aiming to make a profit in the ecommerce industry.
To get a clearer picture of the impact this rate could have on your business, let’s check out the essential abandoned shopping cart statistics:
- The average cart abandonment rate fell by 10% from 2021 to 2022, reaching 70% (SaleCycle)
- The operating systems with the highest cart abandonment rate on mobile are (Kibo):
- iOS (82%)
- Android (81%)
- OS X (72%)
- Windows (more than 68%)
- Online channels with the highest cart abandonment rate are (Kibo):
- Social media platforms (89%)
- Email (80%)
- Direct source (79%)
- Search (75%)
- The average cart abandonment rate across different devices is (Forbes):
- Around 73% on desktop
- About 81% on tablet
- Almost 86% on mobile
- Friday is the day with the lowest abandonment rate, while Sunday is the highest (SaleCycle)
- A whopping 86% of shoppers add an item to their cart only to abandon it before proceeding to checkout (CSA)
- Abandonment rate by the industry (SaleCycle):
- Luxury (88%)
- Fashion (86%)
- Cosmetics (73%)
- Electronics (73%)
- Sports and outdoor (77%)
- Gardening and DIY (72%)
- Groceries (52%)
- Department store (79%)
- Retail (67%)
- Baby & Child (85%)
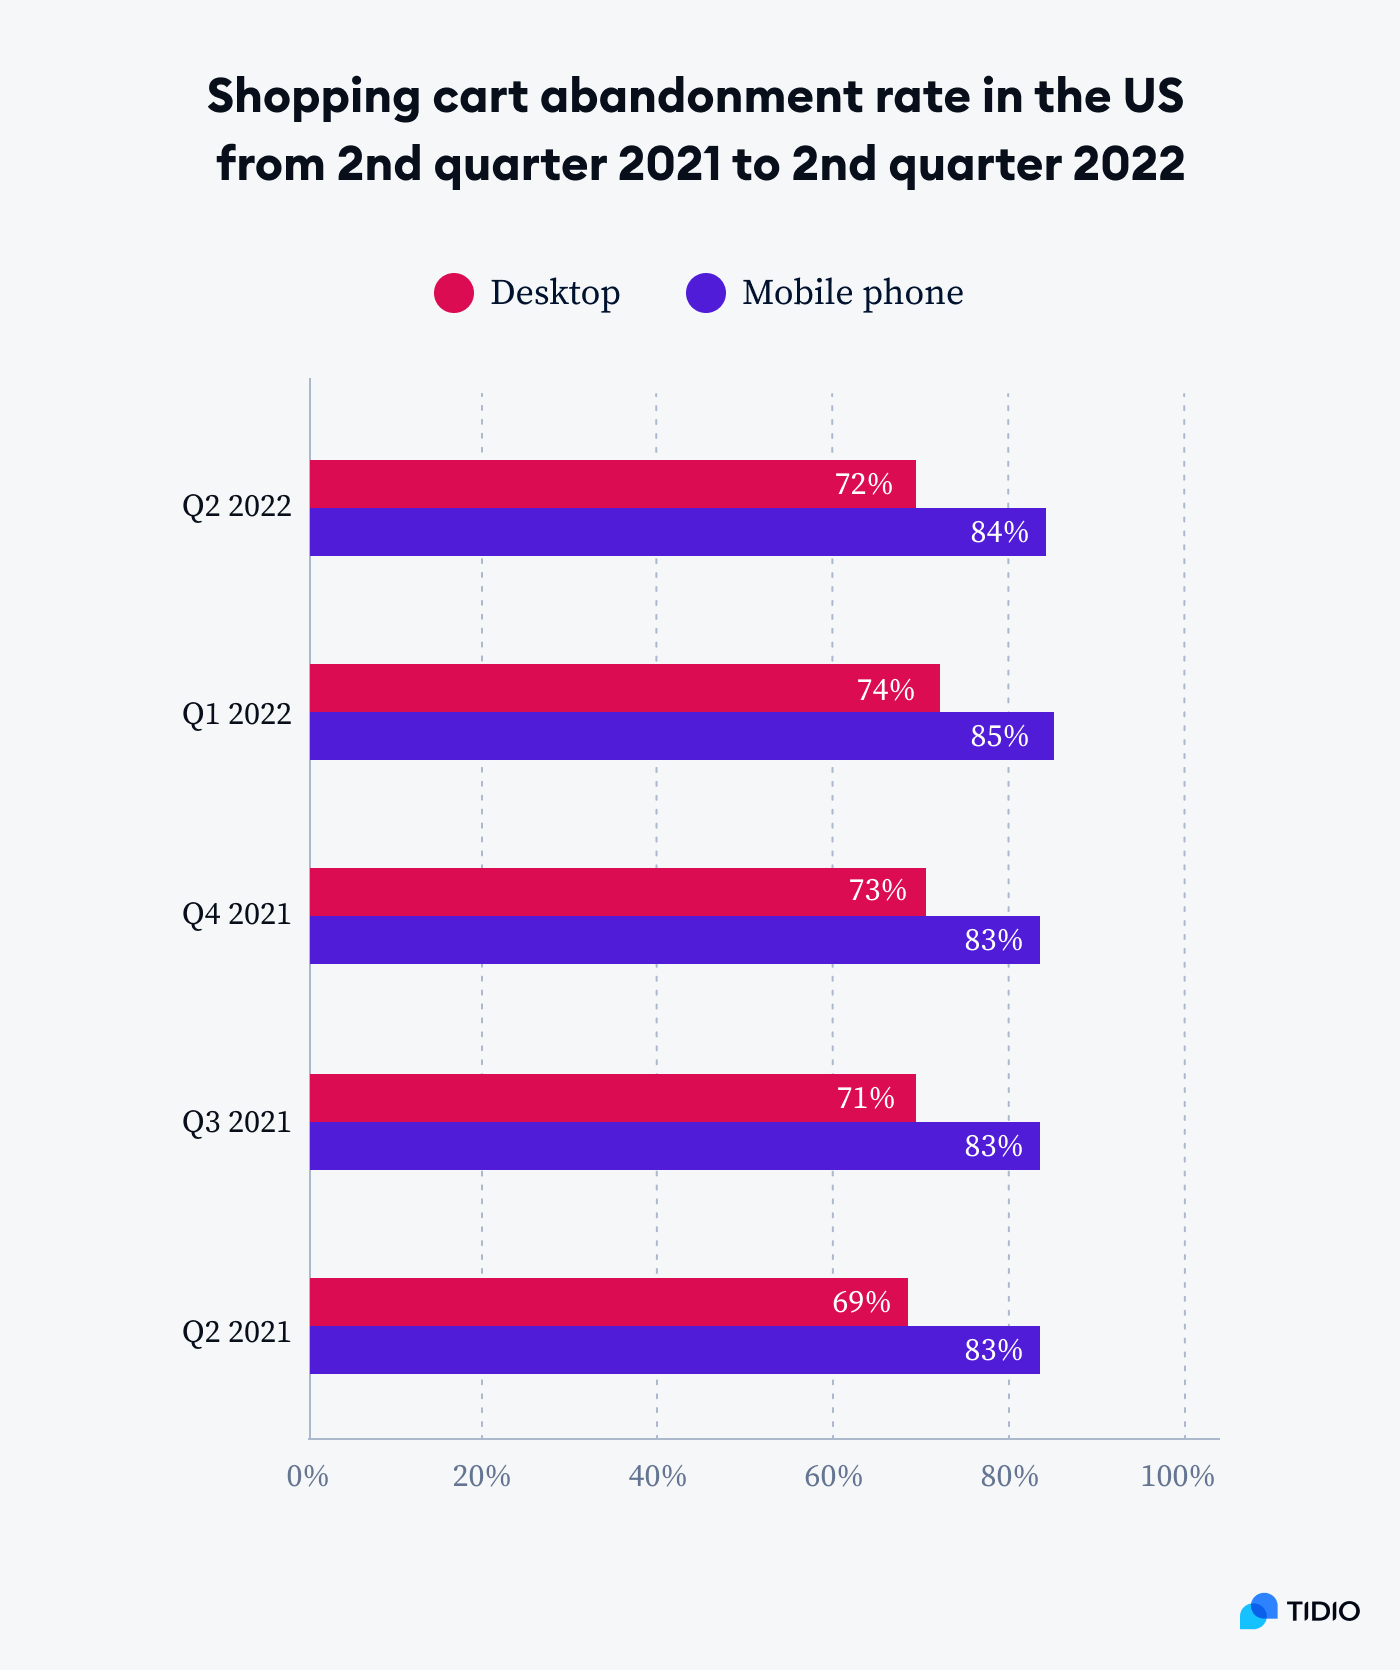
- In the second quarter of 2022, the US shopping cart abandonment rate was about 72% for desktop and over 84% for mobile, which is 3% and 1% higher for each category than in 2021 (Kibo)
Read more: Find out how to write abandoned cart emails and achieve a high cart recovery rate.
Cart abandonment reasons
Now, to start reducing cart abandonment on your online store, you must figure out why customers leave their carts in the first place.
Different studies and research data reveal that there’s a number of reasons why shoppers may not proceed with their purchase. Here are the most vital abandoned cart statistics on this topic.
Extra costs are one of the main reasons why people abandon carts
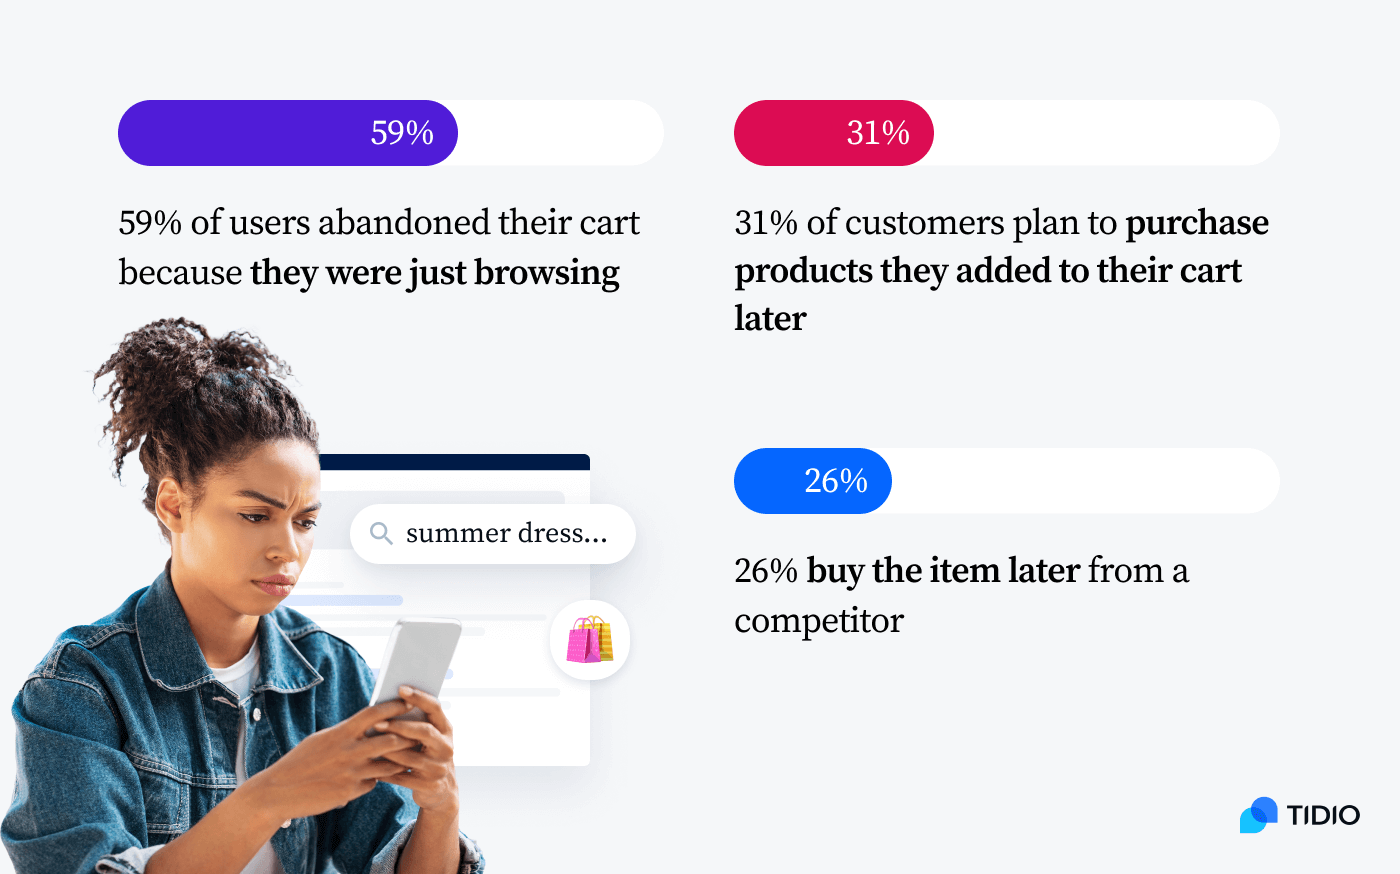
Based on the research done by Baymard Institute, 59% of US customers abandoned their carts because they were just browsing and weren’t ready to buy. And according to Chargebacks911, as many as 31% of customers didn’t go with the purchase as they simply planned to do so at a later time. On the other hand, 26% of shoppers end up buying the item from a competitor later.
Now, while these can be considered sufficient reasons for abandonment, more in-depth research points to many users having issues with the costs during the cart and checkout process.
Namely, for 48% of shoppers, extra costs—such as shipping costs and tax fees—were too high, so they ended up not wanting to proceed with the purchase.

This indicates that you should be upfront and transparent with any additional costs before your shoppers even move forward to the checkout. In addition, you should include the option of free shipping. This way, there’s no room for surprise or disappointment once potential shoppers go down the sales funnel.
Being asked to create an account is the number two reason for abandonment
Another big reason why people abandon their carts is being asked to create an account during the checkout. In fact, as many as 24% of shoppers get put off by this request and end up not going with the purchase.

When you think about it, the reason behind their abandonment is quite logical. After all, many people consider themselves one-time buyers. Therefore, they don’t see why they should go through the hassle of making an account just so they can buy something once.
Adding the guest checkout option can help take care of this issue. This will be more convenient for shoppers who are there for a one-time purchase only.
Moreover, it can make the entire buying process quicker and more user-friendly in general. This is especially important as there are 17% of users who cite too long or complicated checkout process as another big reason behind abandonment.
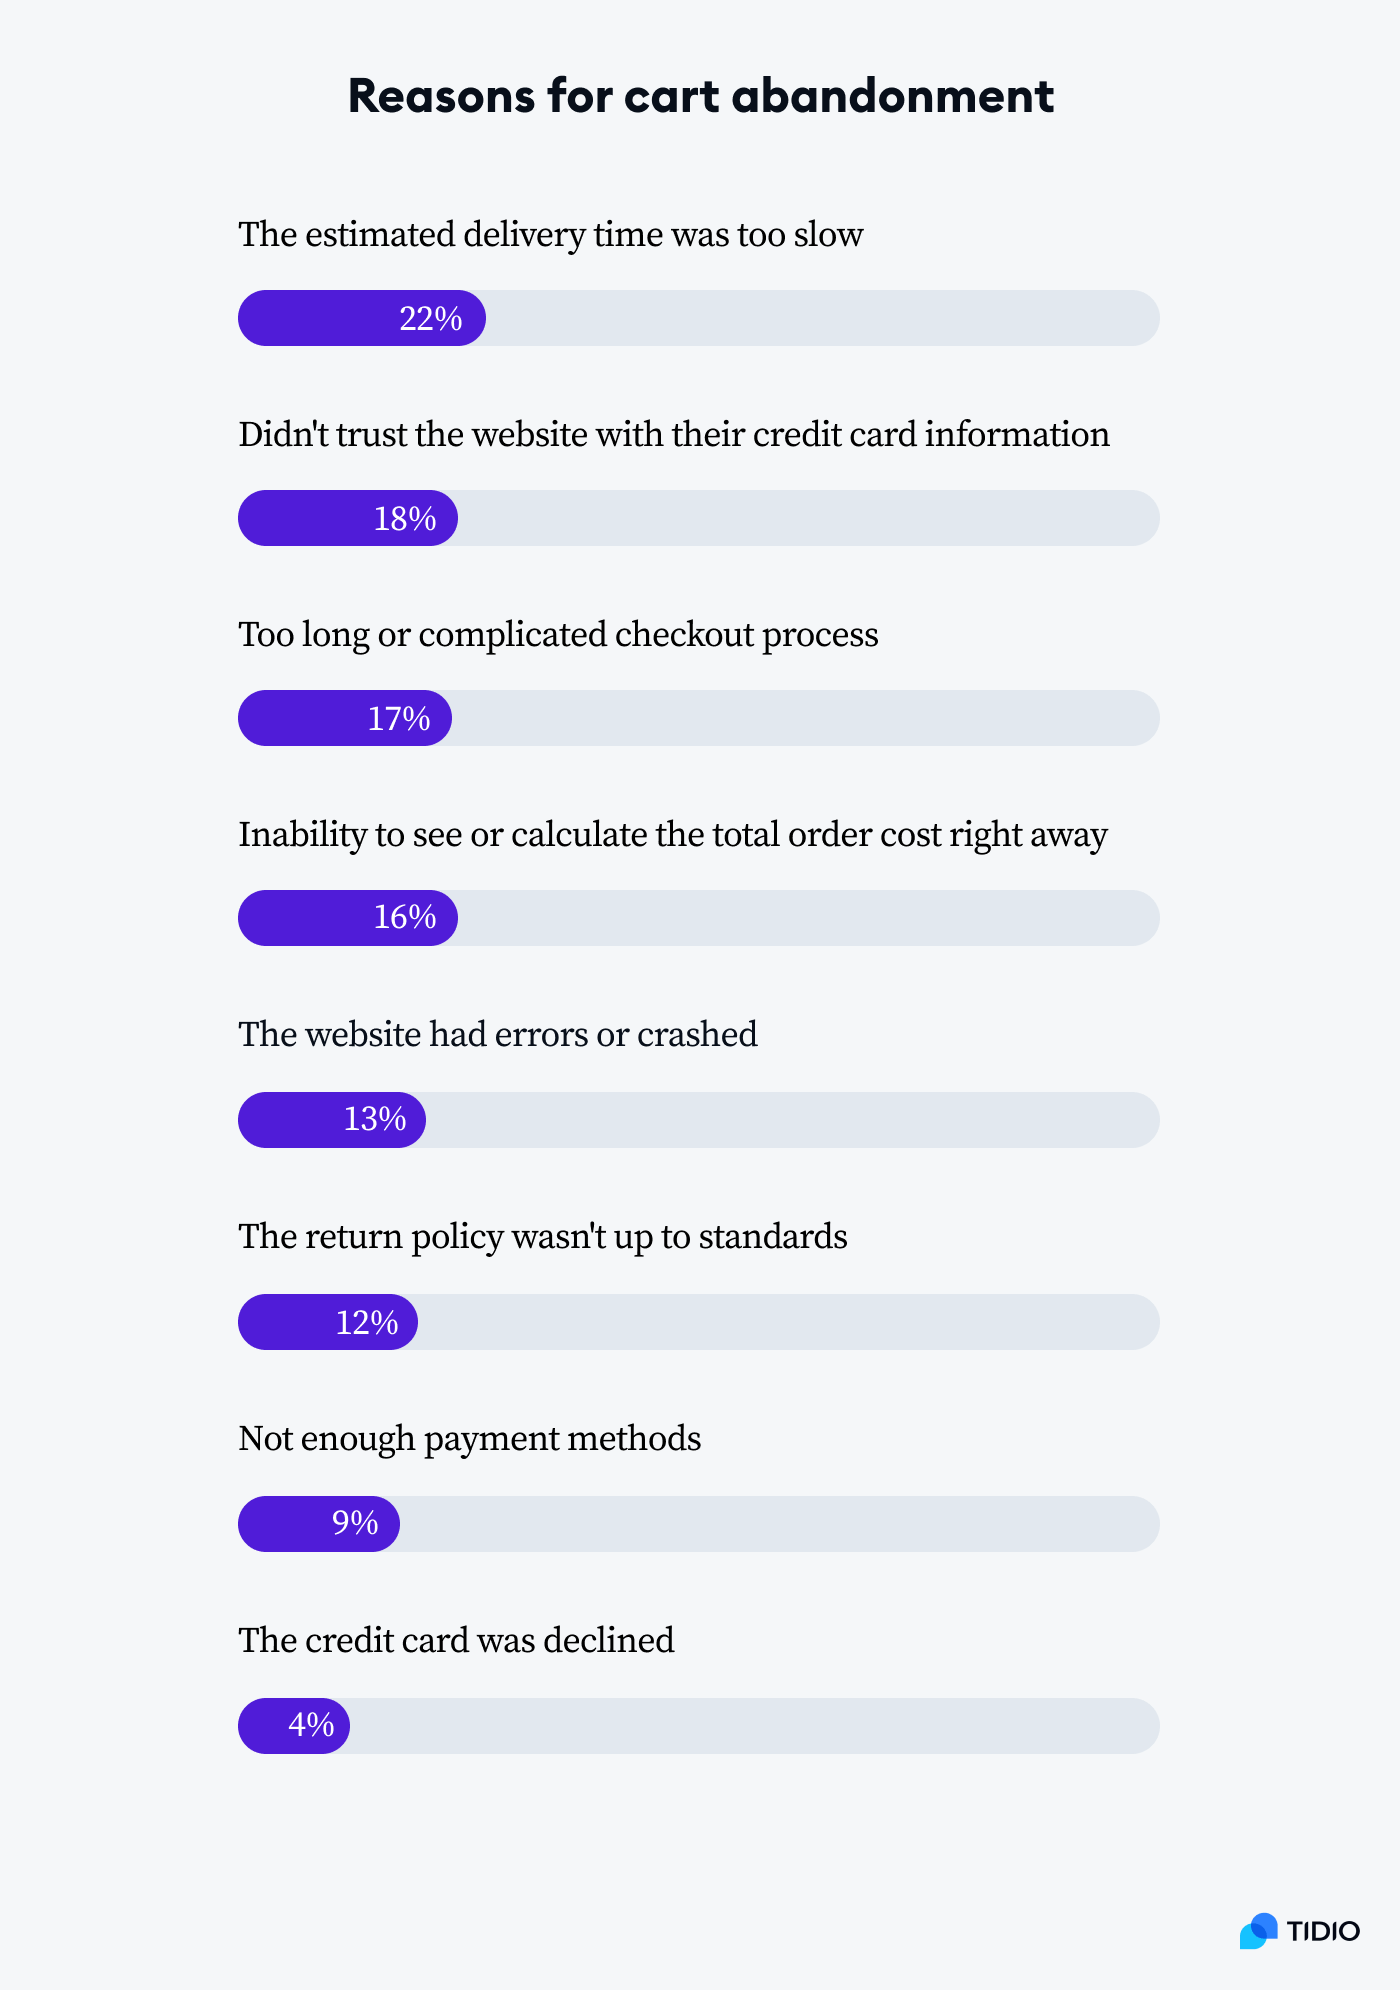
Here are other reasons for abandonment during the cart and checkout process you should consider:
- The estimated delivery time was too slow (22%)
- Didn’t trust the website with their credit card information (18% of users)
- Inability to see or calculate the total order cost right away (16%)
- The website had errors or crashed (13%)
- The return policy wasn’t up to standards (12%)
- Not enough payment methods (9%)
- The credit card was declined (4%)
Read more: Discover which Shopify abandoned cart apps you can use to attract shoppers to your store.
Online shopping cart abandonment effects
The effects of shopping cart abandonment shouldn’t be taken lightly.
Some of the metrics you should pay attention to are revenue loss, the value of abandoned goods, the conversion gap ecommerce brands experience, and more. Let’s check out the key numbers related to the impact of the shopping cart abandonment rate on online retailers.
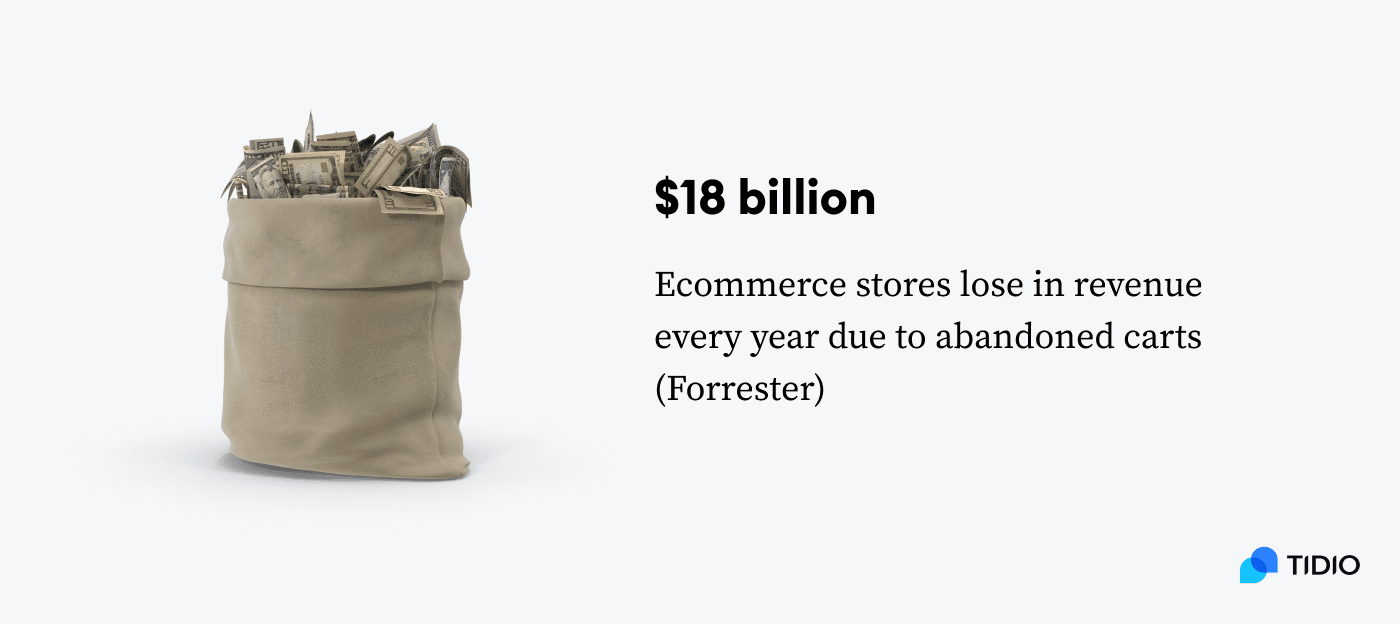
- Ecommerce stores lose as much as $18 billion in revenue every year due to abandoned carts (Forrester)
- The projected yearly value of merchandise that gets abandoned in online carts amounts to around $4 trillion (Business Insider).
- The value of abandoned goods in online shopping carts is around $705 billion in the US alone (eMarketer)
- Lost orders worth $260 billion can be recovered by improving checkout flow and design (Baymard Institute)
- A 65% cart abandonment rate creates a conversion gap of almost 98% (StableWP)
- Slow load times of a website can increase abandonment by 75% (Ready Cloud)
- Customer loyalty drops by a whopping 50% when a website is slow (Ready Cloud)
Read more: Discover how Black Friday and Cyber Monday affect online shopping.
Learn how to boost the number of successful checkouts using AI customer service
Ways to reduce shopping cart abandonment
Okay—so the situation is serious.
Still, there are many different strategies you can implement to reduce ecommerce cart abandonment. Let’s take a look at different tactics in more detail and analyze how they are reflected in numbers.
Take care of your website’s design and optimize for mobile
According to OuterBox, an impressive 79% of users bought a product online using their mobile phones. Therefore, optimizing your checkout pages—and your website in general—for mobile users is practically mandatory.
It’s also important to note that the average ecommerce website can see a boost of over 35% in conversion rate through better checkout design.
So, on top of creating mobile-friendly pages, having a simple, intuitive, and user-friendly design is the way to go.

Provide multiple payment options and an easy checkout
A CSA survey indicates that about 55% of customers are more likely to buy if there is an easier and quicker way to do it on the channel where they learned about the product. Also, as many as 77% of online customers prefer buying on Amazon because of its easy checkout process.
On the other hand, according to StableWP, around 40% of shoppers are more likely to buy a product online if a store offers multiple payment options.
So, let’s see what you can do according to all these statistics.
For one, you can provide an ideal checkout experience by minimizing the number of steps shoppers need to take to complete their purchase. In addition, you can also offer a previously-mentioned guest checkout.
Finally, don’t forget to provide a number of different payment options for users such as ApplePay, PayPal, Stripe, etc.
These tactics will decrease the hassle, improve the customer experience, and help you land more sales.
Consider sending SMS messages to recover sales
According to the SaleCycle trends report, SMS abandonment messages get opened within 90 seconds of being sent, compared to 90 minutes of cart abandonment emails. This indicates that sending SMS messages to users that didn’t buy your products might be a good strategy to recover sales.
Try sending a cart abandonment SMS message an hour after the customer has left their cart. This increases the chances of them coming back and completing their purchase. In fact, as many as 87% of people who abandon carts say they would consider returning if they are given the right prompt, so this strategy is definitely worth giving a try.
Other things to consider when aiming to reduce cart abandonment
Last but not least, here are a few other key statistics you should take into account when creating a perfect strategy to recover abandoned carts (in no particular order):
- 40% of buyers would finish the purchase if they don’t have to create an account (StableWP)
- About 50% of businesses saw a boost in ecommerce sales by adding free shipping (StableWP)
- Some of the top aspects people consider when buying products online are (PowerReviews):
- Customer ratings and reviews (for 94% of online shoppers)Email (80%)
- Free shipping (78%)
- Brand preference (65%)
So—you should also consider adding a guest checkout option, allowing free shipping, and including ratings and reviews on your product pages.
And don’t worry if the online window shopper left their cart behind—you can still bring them back. If all else fails, you can also try using email marketing, pop-ups with coupon and discount codes, and retargeting ads to bring the shoppers back to your ecommerce site and finish their purchase.
Read more: Learn all about the different ways in which you can reduce shopping cart abandonment on your ecommerce store. Also, learn how to effectively track abandoned carts with Tidio.
Conversion rate statistics
While it’s important to be aware of the shopping cart abandonment rate and all stats related to it, the conversion rate is another crucial metric you should consider. It represents the percentage of website visitors that completed a goal divided by the total number of users. This metric can help you figure out whether your efforts of turning visitors into converting customers are paying off.
But how does this relate to cart abandonment?
Well, it’s quite logical. The more your visitors will want to convert, the fewer abandoned carts you will have to deal with.
Let’s take a look at some of the key conversion rate statistics. These can help you provide a convenient user experience for potential customers and increase click-throughs.
The average ecommerce conversion rate was 4% in 2022
The latest Invesp survey shows that the average ecommerce conversion rate is 4%. Also, according to Kibo, this rate in the US decreased by 0.1% in the second quarter of 2022, compared to the second quarter of 2021.
This decrease in percentage may not seem as much, but even the smallest fluctuations like these can make all the difference when it comes to impacting your sales.
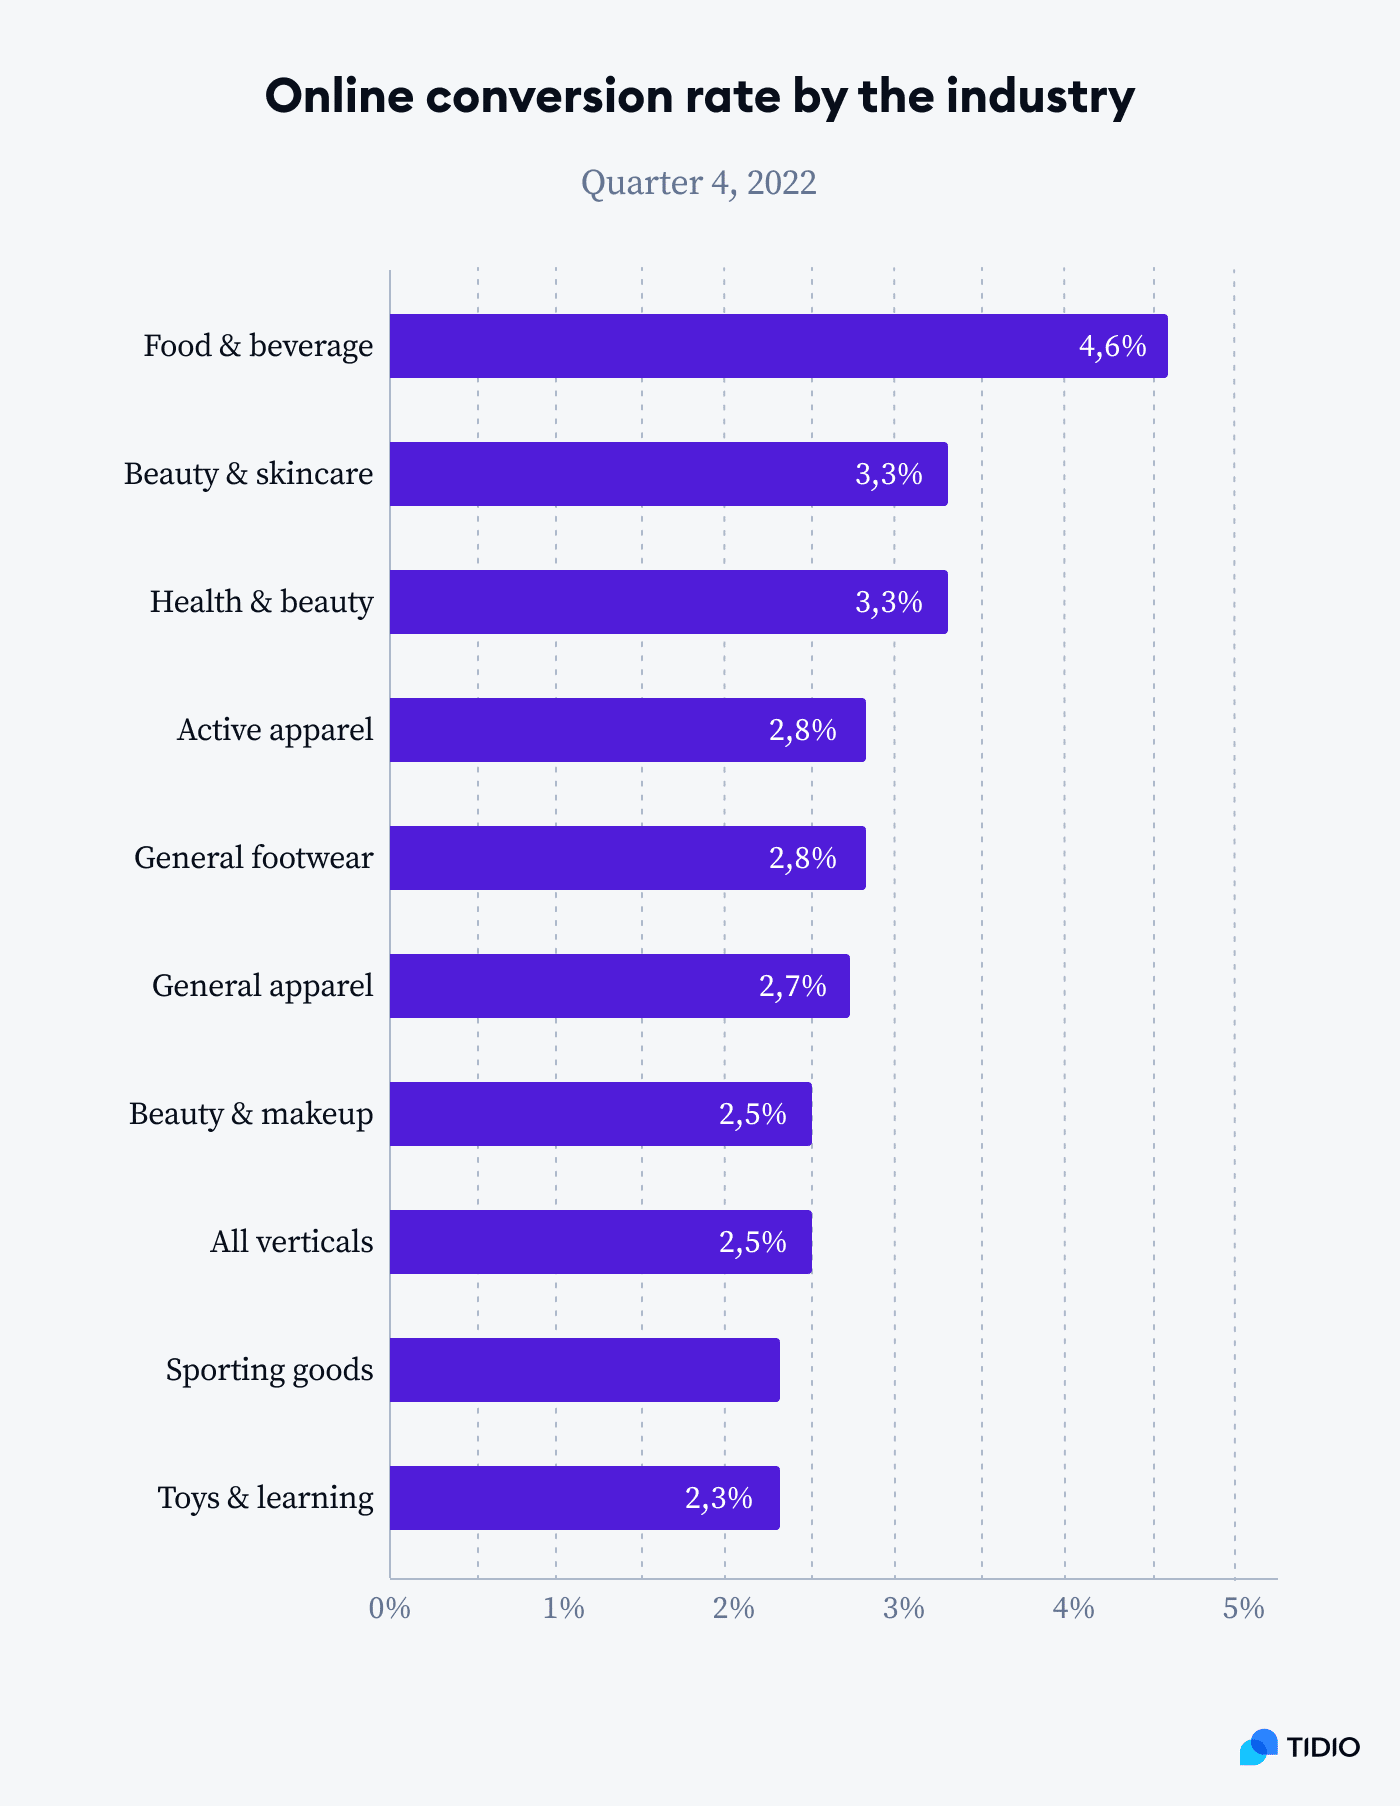
Now, certain industries hold the reputation for having a higher conversion rate than others. And so, Salesforce research states that the food and beverage sector has the highest worldwide rate at ~5%. It’s followed by beauty and skincare with an average rate of 3%, health and beauty (3%), and active apparel (3%).
The most important thing is to understand the average rate in your industry and then compare your own performance with it. Only when you know if you’re meeting the industry standards can you work towards boosting your own average conversion rate.
The average conversion rate by device, days of the week, and hours in the day
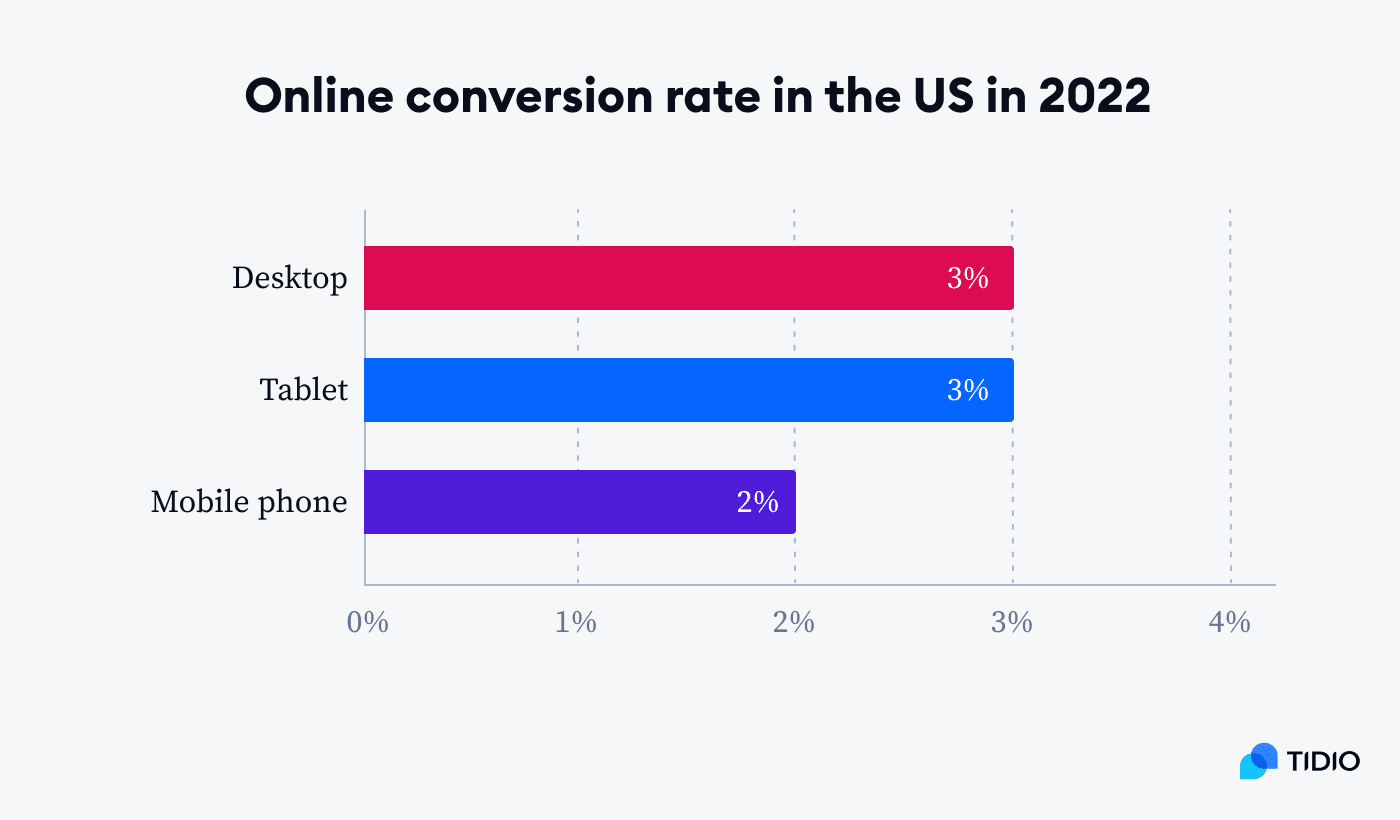
It’s important to note that there’s a slight difference in trends when it comes to different devices people use to buy products online. For example, Kibo research indicates that the online conversion rate in the US in 2022 was the highest for desktop and tablet (at 3%), while it was at only around 2% for mobile.
These stats clearly suggest that shoppers still find it easier to convert on their desktop and tablet devices. And so, once again, you should do your best to optimize your site for those shoppers that plan to convert using mobile.
Some research also points to the higher possibility of conversions during certain days of the week and hours of the day. Namely, SaleCycle reports that Thursday sees the highest number of conversions for fashion products, while 8 pm was the peak hour.
As for the travel industry, Wednesday was the day with the most conversions, while the peak hour was 10 pm.
Even though there are slight differences, it’s hard to miss the following trend—evenings in the middle of the week are the time when conversions tend to reach their biggest potential.
Add-to-cart rate statistics
The add-to-cart rate represents the percentage of visitors that end up adding at least one product to the cart. You should keep track of this metric because it can indicate whether you’re doing well when it comes to your site’s user-friendliness and marketing of your products.
This can also help you determine the best strategy to decrease your shopping cart abandonment.
For example, if your add-to-cart rate is solid, but there are still many carts being left behind, you’ll know that it’s not due to your website’s UX or your campaigns and there are other factors to consider.
Here are some stats related to the add-to-cart rate to help you keep up with the latest trends related to this metric:
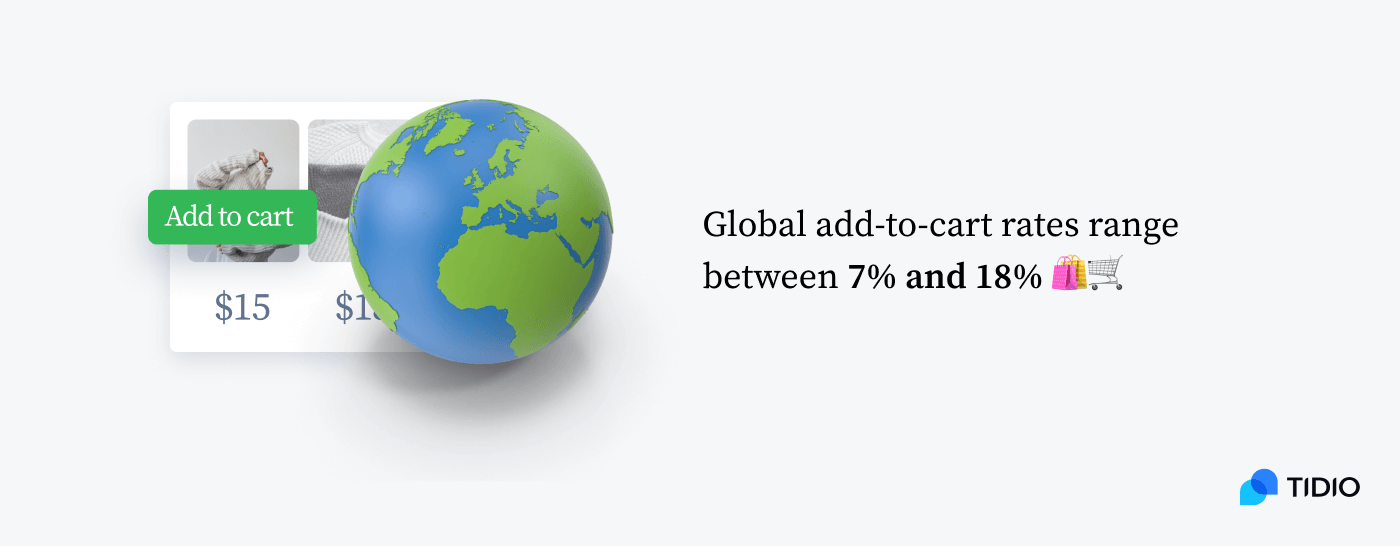
Add-to-cart rates range between 7% and 18% globally
DynamicYield benchmarks show that the global add-to-cart rate is around 7%. There is also another report made by Kibo, which states that global add-to-cart rates can range anywhere between 9% and 18%.
As for specific industries, the DynamicYield report shows that the food and beverage sector has the highest rate of 15%, while the home and furniture industry has the lowest add-to-cart rate (over 3%).
There is also a slight variation in the add-to-cart rate according to different regions. The highest one is in Europe, the Middle East, and Africa (more than 7%), closely followed by South and North America (a bit over 7%), and Asia-Pacific (over 6%).
Finally, when it comes to devices, the add-to-cart rate is as follows (DynamicYield):
- Desktop (7.69%)
- Tablet (7.64%)
- Mobile (6.82%)
Read more: Check out the key add to cart conversion rate statistics.
Product recommendations can help improve add-to-cart rates
According to Kibo, customers who add recommended products to their carts tend to buy considerably more items and have 33% higher average order values.
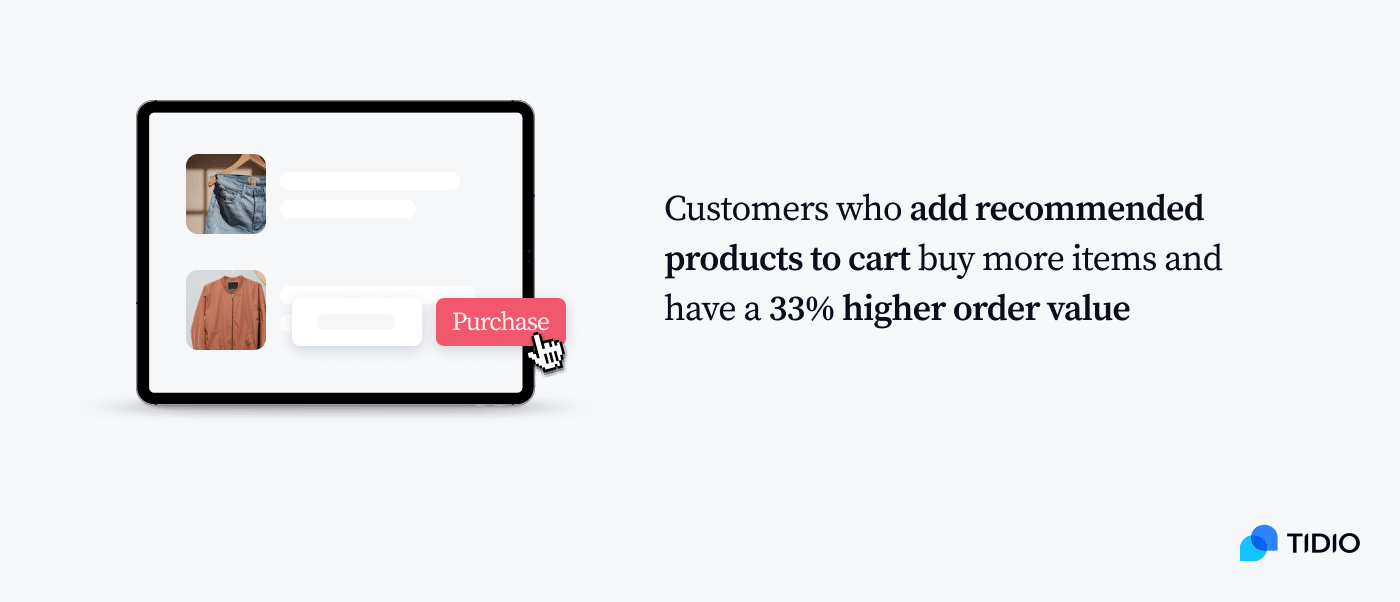
So, when looking to boost this metric, consider adding recommended products to your category, product, and cart pages. This is a useful strategy that can only help your sales skyrocket in the long run.
Read more: Check out the best abandoned cart email subject lines that can help you with recovering your carts and boosting your email open rate. In addition, make sure to take a look at the best email marketing templates and designs.
Shopping cart statistics: key takeaway
And there you have it—a list of the most vital shopping cart abandonment stats that can be found on the web. Here are the key insights to consider:
- A whopping 86% of customers end up adding an item to their cart and then abandon it before checkout
- Monday had the lowest abandonment rate in 2022 while Sunday had the highest
- The biggest reasons for leaving carts include costs being too high and getting asked to create an account
- There’s an $18 billion loss in revenue every year because of abandoned carts
- More than 30% of customers claim they will end up buying products they added to their cart, but they plan to pay later
- The average conversion rate in 2022 was 3.65%
- The global add-to-cart rate stands at around 7%
- The value of abandoned goods in US shopping carts reached $705 billion
- Some of the things people consider when buying products online include customer reviews and free shipping
- And finally, to improve your cart abandonment rate, you should make sure to enhance your checkout design, optimize your website for mobile, and provide multiple payment options.
Having access to all of these insights will help you get a better understanding of cart abandonment trends and the way they can influence your ecommerce business.
In turn, you can work towards improving the cart abandonment rate on your ecommerce store and enhancing the customer experience for your visitors as a whole.
Sources
- Ecommerce Quarterly Benchmarks | Q3 2021
- Why Cart Abandonment Rates Aren’t Falling
- What Is Cart Abandonment? – SaleCycle
- Survey: Long online checkout leads to abandoned carts | Chain Store Age
- 48 Cart Abandonment Rate Statistics 2023 – Cart & Checkout – Baymard Institute
- Online Shopping Cart Abandonment: A $705 BILLION Problem
- Understanding Shopping Cart Abandonment | Forrester
- Shopping Cart Abandonment: An $18 Billion Opportunity (New Ebook)
- SHOPPING CART ABANDONMENT: Merchants Now Leave $4.6 Trillion on the Table, and Mobile Is Making the Problem Worse
- US Ecommerce Forecast 2021 – Insider Intelligence Trends, Forecasts & Statistics
- How to Reduce Cart Abandonment – 12 Powerful Tactics to Boost Your Checkout Conversion Rate
- $4 Trillion & Counting: 2017 Shopping Cart Abandonment Statistics
- Mobile eCommerce Stats in 2023 and the Future Online Shopping Trends of mCommerce
- How to Reduce Cart Abandonment – 12 Powerful Tactics to Boost Your Checkout Conversion Rate
- SaleCycle Ecommerce stats trends report
- New Consumer Survey of More than 6500 Consumers Reveals Increasing Importance of Product Reviews to Establish Trust and Drive Purchase Behavior
- The Average Website Conversion Rate by Industry (Updated by 2022) | Invesp
- Q1 2022 Ecommerce Quarterly Benchmarks Report – Kibo Commerce
- Global conversion rate by industry 2022 | Statista
- What Are Add-to-Cart Rates? How to Calculate and More
- Average add-to-cart rate for eCommerce by industry

